





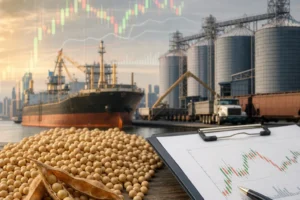

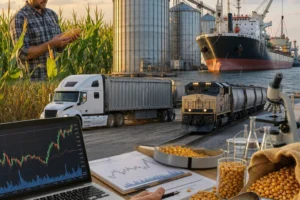


“US soybean prices today” usually refers to two related but different markets: the Chicago futures market that sets the main benchmark, and the local US cash market where soybeans are actually bought from farmers and moved to processors, feed users, river terminals, rail shippers, and export elevators. The geography is the United States, but the price a farmer sees in Iowa, Illinois, Minnesota, Indiana, Nebraska, or at a Gulf export terminal is not identical to the futures quote on a screen. In practice, today’s soybean price depends on where in the US you are looking, what price type you mean, and which delivery point or contract month is being referenced. That is why accurate price checking starts with separating CBOT soybean futures from local cash bids, processor bids, and export prices.
What “US soybean prices today” means
In the United States, soybeans are a major row crop grown mainly in the Midwest and other producing regions, then consumed domestically by crushers and feed markets or shipped for export. When market participants talk about “soybean prices today,” they may be referring to one of several things:
- CBOT soybean futures, the benchmark traded on CME Group’s Chicago Board of Trade platform.
- Local cash bids offered by country elevators, cooperatives, grain merchants, or soybean processors.
- Delivered bids for soybeans hauled to a crush plant, feed mill, rail loader, or river terminal.
- Export prices for soybeans loaded at US export positions, often discussed in terms such as FOB.
US soybean pricing is usually referenced in US dollars per bushel in the domestic market. In export trade, soybeans are also commonly discussed in US dollars per metric ton for international comparison. The benchmark most traders watch is the CBOT soybean futures contract, but physical soybeans are bought and sold through a network of local basis markets across the country.
Where the US soybean market operates
The US soybean market is nationwide, but the pricing system has several layers. Production is concentrated in the Midwest and parts of the Plains, Delta, and eastern Corn Belt. Local buying happens at country elevators, cooperatives, inland terminals, and crushing plants. Larger commercial movement occurs by truck, rail, and barge toward domestic processing centers and export channels.
Two broad physical market zones matter most:
- Interior cash markets, where farmers and local grain owners sell soybeans to nearby buyers.
- Export channels, especially river systems and Gulf export positions, where soybeans are assembled for shipment overseas.
The benchmark futures market operates through the CME Group / CBOT, which is the central reference point for soybean price discovery in the US. But a soybean trade in Illinois or Ohio is still a local physical transaction, with the futures market used as a reference and risk-management tool rather than the full final cash price.
How US soybean prices are formed
US soybean prices are formed by combining a benchmark futures price with a location-specific cash adjustment called basis. This is the key concept readers need to understand.
Futures price is the exchange-traded benchmark. It reflects broad expectations about US and global soybean supply, demand, weather, exports, stocks, and competing oilseed markets.
Basis is the difference between the local cash bid and the futures price. Basis may be positive or negative depending on local market conditions. It reflects:
- Distance to processors, river terminals, or export elevators
- Freight and handling costs
- Local supply at harvest or after harvest
- Buyer competition
- Storage availability
- Quality factors such as moisture, damage, or test weight where relevant
- Seasonal logistics pressure on truck, rail, or barge systems
The final price seen by a farmer or merchant may therefore differ considerably from the headline futures market. A strong processor market can support higher local cash bids even if futures are unchanged. Likewise, futures may rally while a harvest glut weakens local basis and limits the gain in farm-level cash prices.
| Price type | Where quoted | What it means |
|---|---|---|
| CBOT soybean futures | CME Group market data | Benchmark futures value for a specific contract month, not a farm-gate cash price |
| Local cash bid | Elevators, cooperatives, processors, merchants | Actual bid to buy physical soybeans at a named location |
| Delivered bid | Plant, terminal, crusher, or feed buyer | Price for soybeans delivered to a specified destination |
| FOB export price | Export trade reports and commercial market channels | Price of soybeans offered for export at the loading point before ocean freight |
| CIF import price | Import market context outside the US | Delivered import price including cost, insurance, and freight to destination |
Where to check US soybean prices online today
If you need today’s US soybean price, the right source depends on whether you want a benchmark, a local bid, or export market information.
For the benchmark futures market, readers typically check CME Group, which publishes soybean futures and options information for CBOT contracts. This is the primary place to verify the exchange-traded benchmark and follow contract months, delayed quotes, settlement information, and contract descriptions.
For broader US market context, USDA is essential. Different USDA services provide different types of information:
- Agricultural Marketing Service (AMS) for cash market reporting and regional grain market information.
- Foreign Agricultural Service (FAS) for export sales, trade developments, and global competition.
- World Agricultural Supply and Demand Estimates (WASDE) for national and global balance-sheet context.
- National Agricultural Statistics Service (NASS) for acreage, crop progress, and production reporting.
For local physical prices, the most practical source is usually the buyer itself: local elevators, cooperatives, processors, or grain merchants. Many post soybean bids online or through mobile apps, often updated during trading hours. Those bids are generally more useful to farmers than a national headline quote because they reflect the exact delivery point and current basis.
Export-oriented users may also follow USDA export sales and shipment reporting, along with commercial broker and merchant market commentary. Export values are not the same as interior cash bids, but they help explain why basis strengthens or weakens in river and terminal markets.
Cash market versus futures market in practice
The US soybean market only makes sense when online futures trading and real-world physical grain movement are viewed separately.
Futures/options market: This is a financial market. Traders use a broker to buy or sell soybean futures and options on CBOT. These contracts are used for hedging and speculation. Most participants do not take physical delivery. Prices trade almost continuously during exchange hours, and positions are marked to market through margin accounts.
Physical cash market: This is where real soybeans change hands. Farmers, elevators, cooperatives, crushers, feed users, and exporters negotiate bids based on futures plus or minus basis. Soybeans are then delivered by truck, rail, or barge according to the contract terms.
A farmer may watch CBOT prices on a phone but still sell grain physically to a nearby processor under a cash contract, basis contract, hedge-to-arrive contract, or deferred delivery arrangement. A speculative futures trader may never own a single bushel of soybeans.
| Market | Main users | Purpose | What changes hands |
|---|---|---|---|
| CBOT soybean futures | Hedgers, funds, speculators, commercial firms | Price discovery and risk management | Financial contract exposure |
| Local cash market | Farmers, elevators, processors, merchants | Physical soybean purchase and sale | Actual soybeans |
| Export market | Exporters, international buyers, trading houses | Overseas shipment and global trade pricing | Physical soybeans for export loading |
How soybeans are actually bought, sold, exported, and hedged in the US
Physical grain trade
Physical soybean trading usually begins with a local bid from an elevator, cooperative, processor, merchant, or terminal. The seller agrees on quantity, quality terms, delivery window, and payment terms. Common contract structures may include spot cash sales, forward contracts, basis contracts, or other commercial arrangements offered by the buyer.
Buyers then move soybeans into domestic processing or export channels. Soybeans are heavily consumed by crushers that produce soybean meal and soybean oil. Exporters accumulate beans from interior locations and ship them through major logistics corridors, especially rail and barge-linked systems leading to export terminals.
Counterparty quality matters. Sellers need to understand:
- Who the buyer is
- Where delivery takes place
- How moisture or quality discounts are applied
- When title transfers
- When payment is due
Futures and options hedging
Hedging normally happens through a futures broker with access to CBOT soybean contracts. A farmer, elevator, processor, or exporter may sell futures to protect against falling prices, or buy futures to cover future needs. Options may be used to create price floors or manage upside risk while limiting some downside exposure.
However, hedging does not remove basis risk. Even if futures protection works as expected, the local cash price can still change because basis may strengthen or weaken. That is why commercial grain management often separates a futures decision from a basis decision.
Margin requirements and leverage apply in futures trading, so it is not the same as storing grain or signing a cash contract. Financial exposure can move quickly, even when a physical grain position is unchanged.
Main drivers of US soybean prices now
“Today’s” soybean market in the US is influenced by a mix of domestic and global factors. No single factor explains every move, but the most important drivers usually include:
- US weather, especially during planting, pod-setting, and harvest
- US acreage and yield expectations
- US crush demand from meal and oil markets
- Export demand, especially from major importing countries
- Competition from South America, particularly Brazil and Argentina
- River, rail, and port logistics
- Currency movements, which affect export competitiveness
- Biofuel and vegetable oil market developments
- US stocks and global oilseed inventories
In seasonal terms, the market often reacts differently during planting, summer weather, harvest pressure, and post-harvest storage periods. Local cash prices can also diverge from national sentiment if a processor needs nearby supply or if transportation bottlenecks disrupt normal movement.
How to read a soybean quote correctly
Before using any “today” price, readers should confirm five details:
- Commodity: soybeans, not soybean meal or soybean oil.
- Market: CBOT futures, local cash bid, processor bid, or export value.
- Location: specific US state, plant, elevator, river point, or terminal.
- Unit and currency: usually US dollars per bushel domestically.
- Date or contract month: nearby futures month and quote time matter.
This is especially important because financial media may display a bean futures quote while local buyers pay a cash price that includes basis and quality adjustments. The two are connected, but they are not the same number.
Outlook for US soybean prices
Any forecast for US soybean prices should be treated as a scenario, not a certainty. The market can change quickly if weather shifts, export sales accelerate, South American supplies change, or domestic crushing margins improve or weaken.
A tighter-price scenario would usually involve some combination of weather stress, lower-than-expected yields, stronger crush demand, firm export interest, or transport constraints that strengthen basis in key regions. A softer-price scenario would usually involve favorable crop conditions, comfortable stocks, weak export demand, or strong competition from other exporters.
For practical decision-making, many commercial participants watch not only headline futures direction but also local basis behavior. A futures rally with weak basis may offer less cash opportunity than a moderate futures move combined with a strong processor or export basis.
Frequently asked questions
Where can I check US soybean prices today?
For benchmark futures, check CME Group’s soybean market data. For US cash and regional market context, use USDA reporting, especially AMS. For the actual price available to sell physical beans, check local elevator, cooperative, processor, or merchant bids.
Is the CBOT soybean price the same as the farm price?
No. The CBOT price is a futures benchmark. A farm-level or elevator cash price is usually the futures price adjusted by local basis, plus any quality or delivery factors.
What is the main benchmark for US soybeans?
The main benchmark is CBOT soybean futures traded through CME Group. This benchmark is widely used by farmers, elevators, crushers, exporters, and risk managers across the United States.
Why do soybean prices differ from one US state to another?
Local basis varies by freight cost, buyer competition, processor demand, export access, storage constraints, and seasonal supply pressure. That means soybeans in one region can trade at a noticeably different cash price than soybeans in another.
How are US soybeans sold physically?
They are usually sold to local elevators, cooperatives, processors, merchants, or terminals under a cash or forward contract. The grain is then delivered to the agreed location and paid according to the contract terms and grade results.
How do traders hedge soybean prices in the US?
They typically use CBOT futures or options through a broker. Commercial hedgers use these instruments to reduce price risk, but they still face basis risk in the physical market.
Does the US export soybean prices in bushels or metric tons?
Domestic US market discussions commonly use dollars per bushel. International export trade is often compared in dollars per metric ton, especially when looking at competing origins and import tenders.
What reports matter most for soybean price direction?
Key reports include USDA crop progress, acreage and production updates, WASDE balance sheets, and export sales reports. Traders also watch CME futures activity and local cash markets for real-time demand signals.
Sources
- CME Group
- USDA Agricultural Marketing Service
- USDA World Agricultural Outlook Board