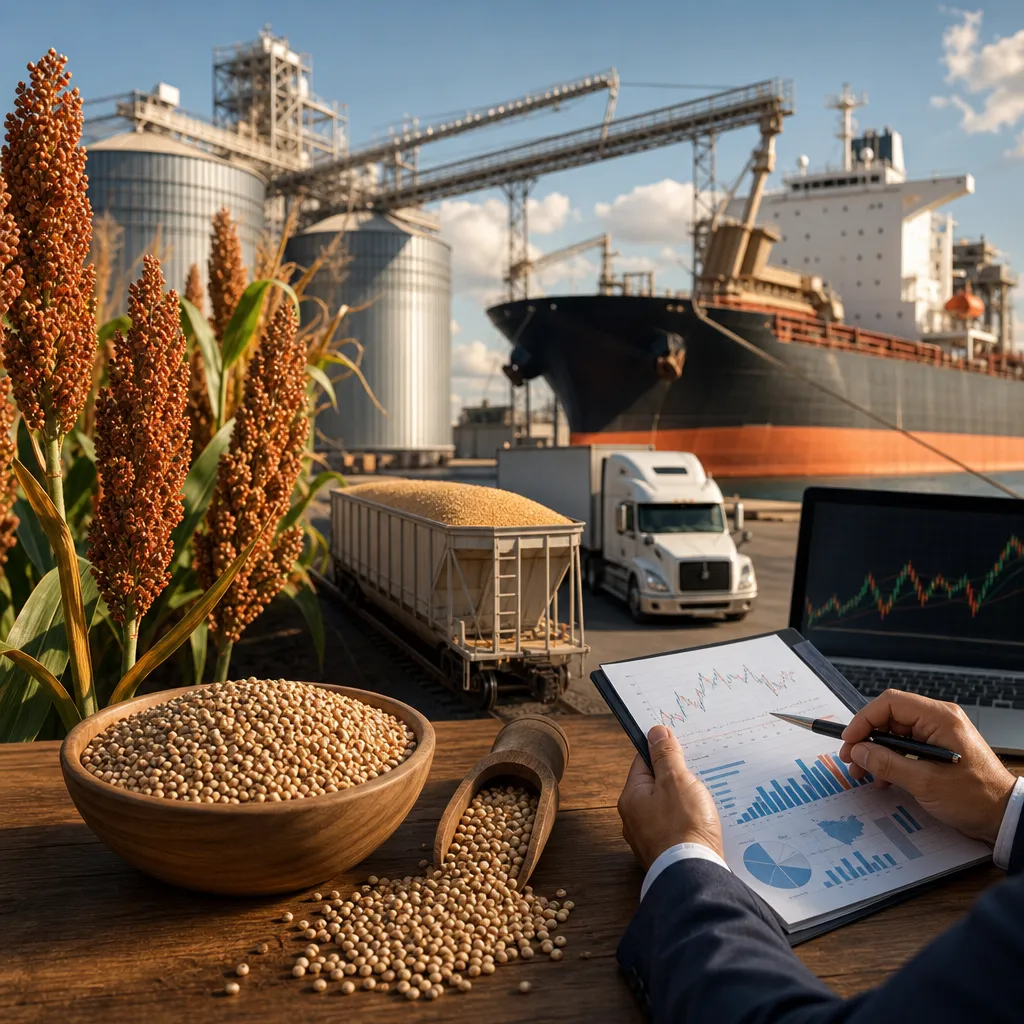







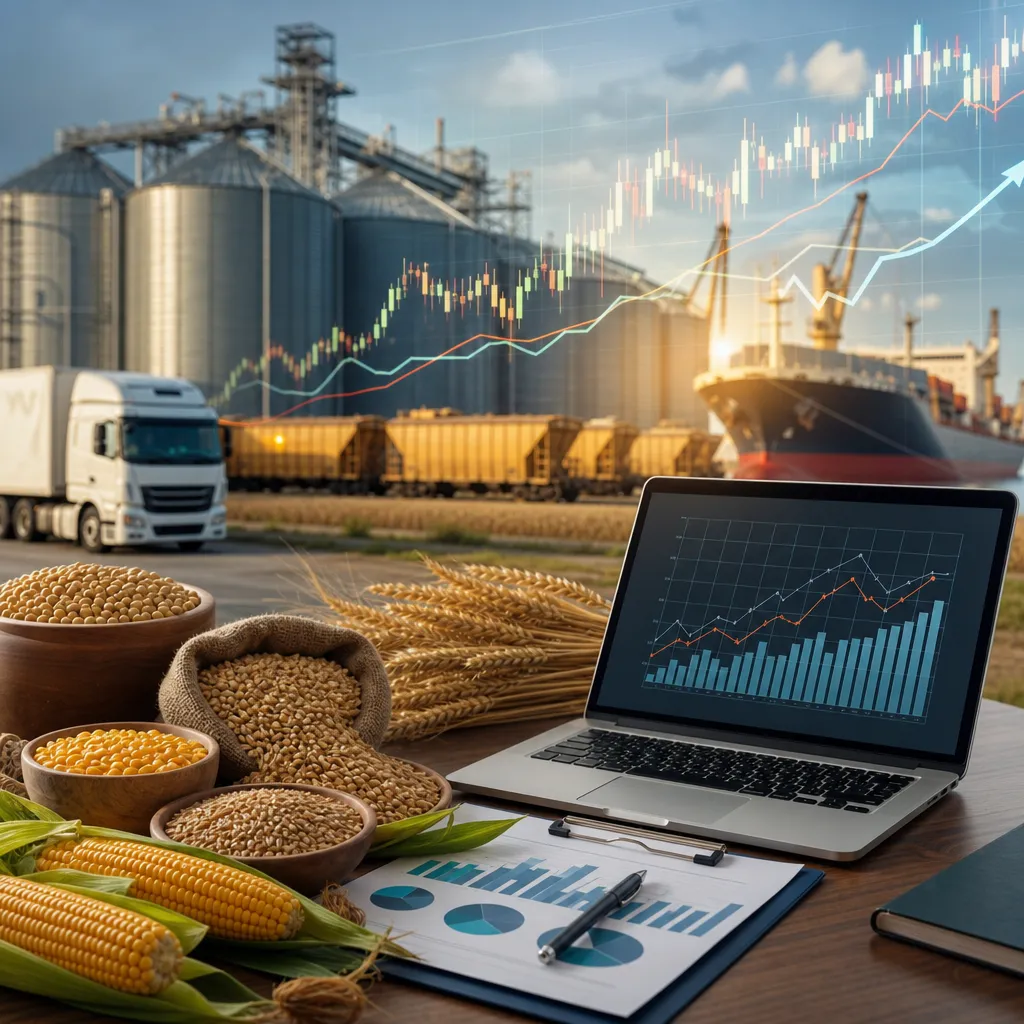
The United States grain market is not a single price point but a network of futures exchanges, local cash markets, river terminals, feed mills, ethanol plants, export elevators, and processors spread across the country. A practical US grain price forecast therefore starts with geography: corn and soybeans are heavily centered in the Midwest, wheat pricing varies by class and region, and export values are shaped by Gulf, Pacific Northwest, and other logistics corridors. Most US grain prices are influenced by benchmark futures traded in Chicago, but the actual price paid to a farmer or charged to a buyer is usually a local cash price adjusted by basis, quality, and freight. Anyone looking for a forecast also needs to know where to check live market information and how physical grain trade differs from futures trading.
What “US grain price forecast” means
In the US context, a grain price forecast usually refers to expected direction and risk for major crops such as corn, soybeans, and wheat. It may concern national benchmark futures, regional cash bids, export values, or delivered feed and processor markets. Because the US is both a major producer and major exporter, domestic grain prices are linked to global supply and demand as well as local conditions.
The most widely watched benchmarks are futures listed by CME Group, especially Chicago Board of Trade contracts for corn, soybeans, and soft red winter wheat. However, US physical grain does not trade only at Chicago-equivalent values. Grain is bought and sold through country elevators, cooperatives, grain merchants, feed manufacturers, flour mills, ethanol plants, soybean processors, and exporters, each with a location-specific bid.
Prices are usually discussed in US dollars. Futures are commonly quoted in cents per bushel or dollars per bushel, while export and some commercial physical transactions may also be discussed in dollars per metric ton or short ton depending on the context. Local cash bids in farm regions are commonly quoted in dollars per bushel.
Where the US grain market operates
The US grain market operates on several layers at once. Benchmark financial pricing is centered on futures exchanges, but physical grain trade is dispersed across producing and consuming regions.
- Midwest Corn Belt: Core production area for corn and soybeans, with dense networks of elevators, processors, and rail loading points.
- Great Plains: Important for wheat, including hard red winter and hard red spring supply chains depending on the state and region.
- Mississippi River system: Critical for barge movement of grain toward export channels.
- US Gulf export market: A major reference point for export competitiveness, especially for corn and soybeans.
- Pacific Northwest: Important export corridor, especially for some wheat and Asian-facing grain trade.
- Domestic consuming markets: Feedlots, poultry and hog sectors, mills, ethanol facilities, and soybean crushers all create local demand centers.
That geography matters because farmers in Iowa, Illinois, Kansas, North Dakota, or Ohio do not all face the same cash price, even when they are watching the same futures market online. Freight access, regional surplus or deficit, and buyer competition create local differences.
| Market layer | Where it operates | Why it matters for price |
|---|---|---|
| Futures market | CME Group / CBOT benchmark trading | Sets widely used reference prices and hedging tools |
| Country cash market | Local elevators, cooperatives, processors | Determines what farmers actually receive locally |
| Delivered domestic market | Feed mills, ethanol plants, crushers, flour mills | Reflects end-user demand and transport costs |
| Export market | Gulf, PNW, and other terminal channels | Connects US grain values to world buyers and competing origins |
How US grain prices are formed
US grain prices are formed through the interaction of benchmark futures and local cash market conditions. The key concept is that futures are not the same as cash.
A futures price is the exchange-traded benchmark for a specified contract month. A local cash bid is the amount a local buyer is offering for immediate or nearby physical grain at a specific location. The difference between the two is called the basis.
In simple terms:
- Futures price: Exchange benchmark used for price discovery and hedging.
- Basis: Local premium or discount relative to futures.
- Cash bid: Futures plus or minus basis, adjusted for local market conditions.
- Delivered price: Price to a destination such as a mill, crusher, or feed plant, including freight to that point.
- FOB export price: Value of grain loaded for export at a named origin point, often used in international trade context.
- CIF import price: Delivered import value including freight and insurance to the destination country; this matters when comparing US grain to competing origins abroad.
Several factors shape the basis and final cash price:
- Distance to river, rail, processor, or export terminal
- Local harvest pressure or nearby shortage
- Storage availability
- Grain quality and test weight
- Protein or other class characteristics for wheat
- Buyer competition in the area
- Barge, rail, truck, and export logistics
- Currency moves affecting export competitiveness, even though domestic prices are in US dollars
For this reason, it is inaccurate to present a CBOT quote as the exact farm-gate price. A producer in Nebraska may track the same futures contract as a producer in Indiana, but the cash bids can differ materially.
| Price type | Where quoted | What it means in practice |
|---|---|---|
| CBOT futures | CME Group market data and broker platforms | Benchmark price for hedging and market direction |
| Cash bid | Elevators, cooperatives, processors | Actual local buying price for physical grain |
| Basis | Buyer bid sheets, merchandising systems | Local premium or discount to futures |
| Delivered bid | Consumer or processor offers | Price at a named destination after transport |
| FOB export value | Export trade reports and merchant indications | Value for grain at an export loading point |
How to check US grain prices online
If you need a current US grain price, the right source depends on whether you want futures or physical cash.
For benchmark futures, readers commonly check CME Group market pages or broker and trading platforms that carry CBOT grain contracts. Those sources show the exchange-traded reference market, contract month, and delayed or live pricing depending on the service.
For national balance sheets, outlook, and export context, USDA is essential. Practical USDA sources include:
- World Agricultural Supply and Demand Estimates (WASDE): Broad outlook for US and global supply, use, and stocks.
- National Agricultural Statistics Service (NASS): Acreage, crop progress, yield, and production reporting.
- Agricultural Marketing Service (AMS): Market news and some regional grain bid and basis information.
- Foreign Agricultural Service (FAS): Export sales and international trade perspective.
For local cash prices, readers should check the websites or bid pages of:
- Local grain elevators
- Farmer cooperatives
- Ethanol plants
- Soybean crushers
- Flour mills or feed mills where relevant
- Regional grain merchandisers
Those local bids often update throughout the day and may differ sharply from futures because they include basis, freight, quality, and immediate demand.
Practical forecast framework for US grain prices
A useful US grain price forecast is scenario-based, not a claim of certainty. Grain markets react to weather, acreage, yields, policy, exports, and macro conditions, often changing quickly between planting and harvest.
For corn and soybeans, the market often focuses on spring planting progress, summer weather in the Midwest, and autumn harvest pressure. In wheat, the forecast depends more heavily on class-specific conditions, winter survival, Plains moisture, spring wheat prospects, and export competition.
The most important forecasting drivers usually include:
- Acreage: More planted area can increase potential production, all else equal.
- Weather: Heat, dryness, excessive rain, and early frost can all shift yield expectations.
- Crop condition and yield trends: USDA reports are heavily watched for this reason.
- Stocks: Tight ending stocks generally increase price sensitivity to weather or demand surprises.
- Export demand: US competitiveness depends on world buyers and rival exporters.
- Feed demand: Livestock margins and herd or flock conditions matter for corn and some wheat demand.
- Biofuels: Ethanol demand supports corn; renewable fuel and vegetable oil dynamics can affect soybeans.
- Currency and macro factors: A stronger US dollar can make US exports less competitive.
- Logistics: River levels, rail conditions, and port efficiency can move basis and export spreads.
| Scenario | Typical conditions | Possible market implication |
|---|---|---|
| Bearish supply scenario | Large acreage, favorable weather, strong yields, smooth harvest | Pressure on futures and harvest-time cash bids, especially where storage is tight |
| Bullish weather scenario | Widespread stress during key growth stages | Higher futures volatility and stronger nearby pricing response |
| Strong demand scenario | Improving exports, firm processor margins, active domestic consumption | Supportive basis and better interior bids in demand centers |
| Logistics disruption scenario | River, rail, or port bottlenecks | Wider regional price gaps and unusual basis movement |
US exports, imports, and international price linkage
The US is a major exporter of corn, soybeans, and wheat, so domestic grain prices are tied to world markets. Gulf and Pacific Northwest export values help determine whether US grain is competitive against supplies from South America, the Black Sea region, Canada, Australia, and other origins depending on commodity and season.
When export demand is strong, inland basis near river and rail channels may improve as merchants try to secure supply. When world buyers shift to cheaper competing origins, US export bids can soften, and that can flow back into local cash markets.
The US also imports certain grain or grain-related products in some regions or periods, but for the major bulk grain complex the more important issue is usually export competitiveness rather than import dependence.
International buyers often compare origins using FOB or CIF values, while US farmers usually sell on a local cash basis. That difference explains why global headlines do not always match what a county elevator is bidding on a given day.
How grain is actually bought and sold in the US physical market
Physical grain trade in the US normally takes place through commercial contracts, not through retail-style online purchase of warehouse grain by most participants. Farmers generally deliver to a local elevator, cooperative, processor, or merchant under a contract spelling out price terms, delivery period, quality requirements, discount schedules, and payment conditions.
Common physical marketing methods include:
- Spot cash sale: Grain is sold at the current local cash bid.
- Forward contract: Price or basis is agreed before delivery, often for future harvest or post-harvest movement.
- Basis contract: Basis is fixed while futures are priced later.
- Hedge-to-arrive type structure: Futures component is fixed first, while basis is set later, depending on buyer terms.
- Stored grain sale: Producer stores grain on-farm or commercially and sells later when basis or futures improve.
Buyers include local elevators, feed users, ethanol plants, crushers, mills, and exporters. The practical issues are quality specs, moisture, test weight, protein where relevant, timing, freight obligations, and buyer creditworthiness. Physical ownership, logistics, shrink, storage costs, and settlement all matter in this market.
How futures and options are used for hedging in the US
Futures and options trading is separate from physical grain ownership. A producer, merchant, processor, or end user may use CBOT contracts through a broker to hedge price risk without delivering grain into exchange channels.
In practice:
- A hedger opens a futures trading account through a brokerage firm.
- The account requires margin because futures are leveraged instruments.
- The user buys or sells contracts to offset exposure in the physical market.
- The hedge is later offset financially; most participants do not make or take delivery through the exchange.
For example, a corn grower may sell futures to reduce downside price risk ahead of a physical sale, while an ethanol plant may buy futures to protect input costs. Options may be used to create a price floor or ceiling with limited downside to the premium paid, though basis risk still remains.
The key risk is that futures hedging does not eliminate local basis changes. A producer can be correct on futures direction but still face weaker local cash performance if basis widens.
Key trends to watch in a US grain price forecast
The most practical way to monitor the US grain outlook is to combine benchmark futures, USDA reporting, and local basis trends. Market participants should pay special attention to whether a move is driven by national supply expectations or by regional logistics and demand.
Some of the most important trend indicators are:
- USDA acreage and quarterly stocks reports
- Weekly crop progress and condition reports
- Export sales and shipment pace
- Ethanol and crush demand signals
- Basis movement during planting, harvest, and post-harvest storage periods
- Weather in major US growing belts and in competing exporter regions
- US dollar direction and broader commodity fund activity
In many years, harvest tends to pressure local cash prices in surplus areas, while post-harvest logistics or processor demand can later improve basis. But that pattern is never guaranteed; stocks, storage economics, and export pull can change the outcome.
Frequently asked questions
Where can I check current US grain prices?
Use CME Group or a broker platform for futures prices, and local elevator, cooperative, processor, or merchandiser bid pages for cash prices. USDA AMS and other USDA reports help with market context but do not replace local bids.
What is the main benchmark for US grain prices?
For corn, soybeans, and one major wheat contract, the main benchmark is usually CBOT futures traded through CME Group. Some wheat markets also watch class-specific futures depending on region and use.
Why is my local cash bid different from the futures price?
Because cash price equals futures adjusted by basis and local factors. Freight, storage, quality, nearby supply, and buyer competition can all widen or narrow the gap.
How do farmers usually sell grain in the US?
Most sell physically to elevators, cooperatives, processors, mills, feed users, or exporters under cash, forward, basis, or similar merchandising contracts. They may monitor futures online, but the actual grain sale is usually local and contract-based.
Can I trade US grain prices without buying physical grain?
Yes. Futures and options can be traded through a broker for hedging or speculation. That gives financial price exposure, but it is not the same as owning, storing, or delivering grain.
What matters more for a US grain forecast: weather or exports?
Both matter, but at different times. During planting and growing seasons, weather can dominate. Later, export pace, domestic demand, and stocks often play a larger role in confirming or offsetting the supply story.
Are US grain export prices the same as farm prices?
No. Export values reflect terminal location and international trade terms such as FOB, while farm prices are local cash bids at interior points. Freight and basis connect the two but do not make them identical.
What units are commonly used in the US grain market?
US futures and local cash grain are commonly quoted in bushels and US dollars. Export markets and international comparisons may also use metric tons, especially in trade reporting.
Sources
- USDA World Agricultural Supply and Demand Estimates
- USDA Agricultural Marketing Service
- CME Group