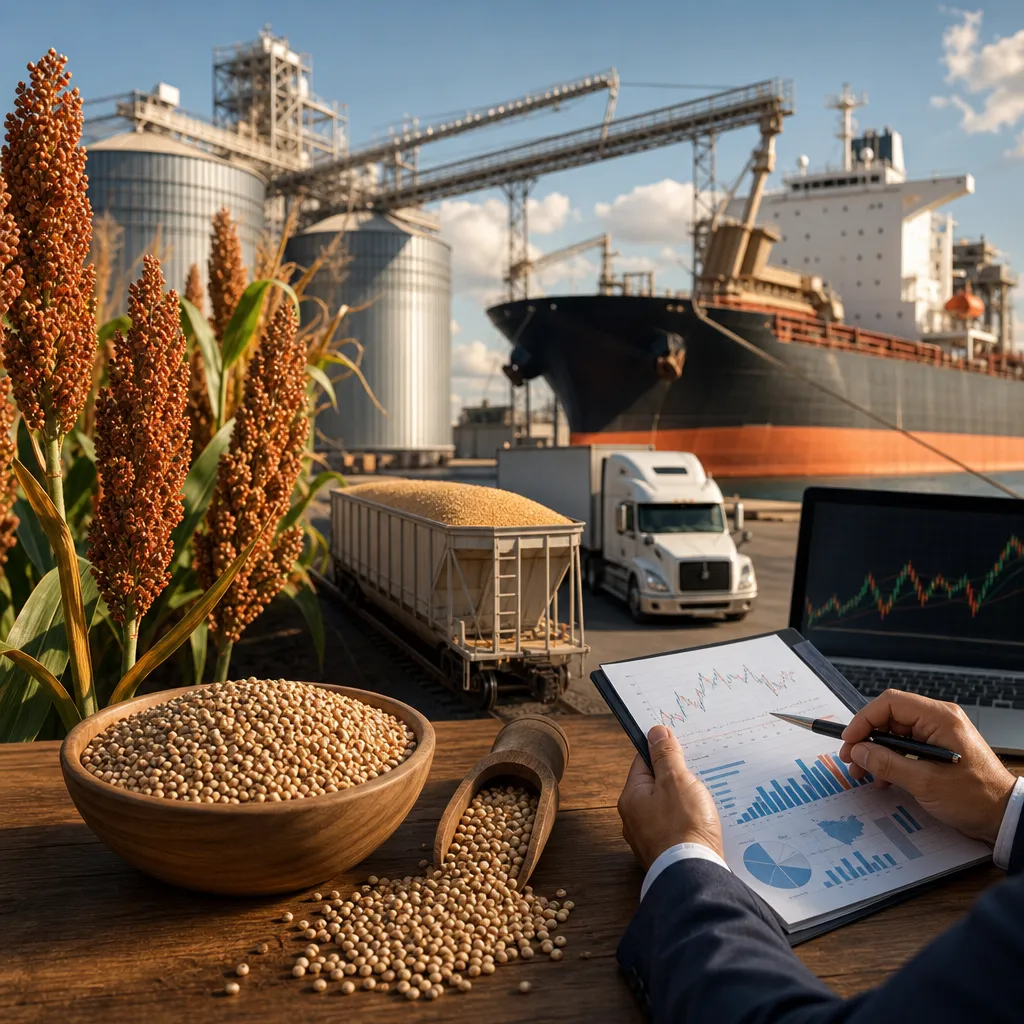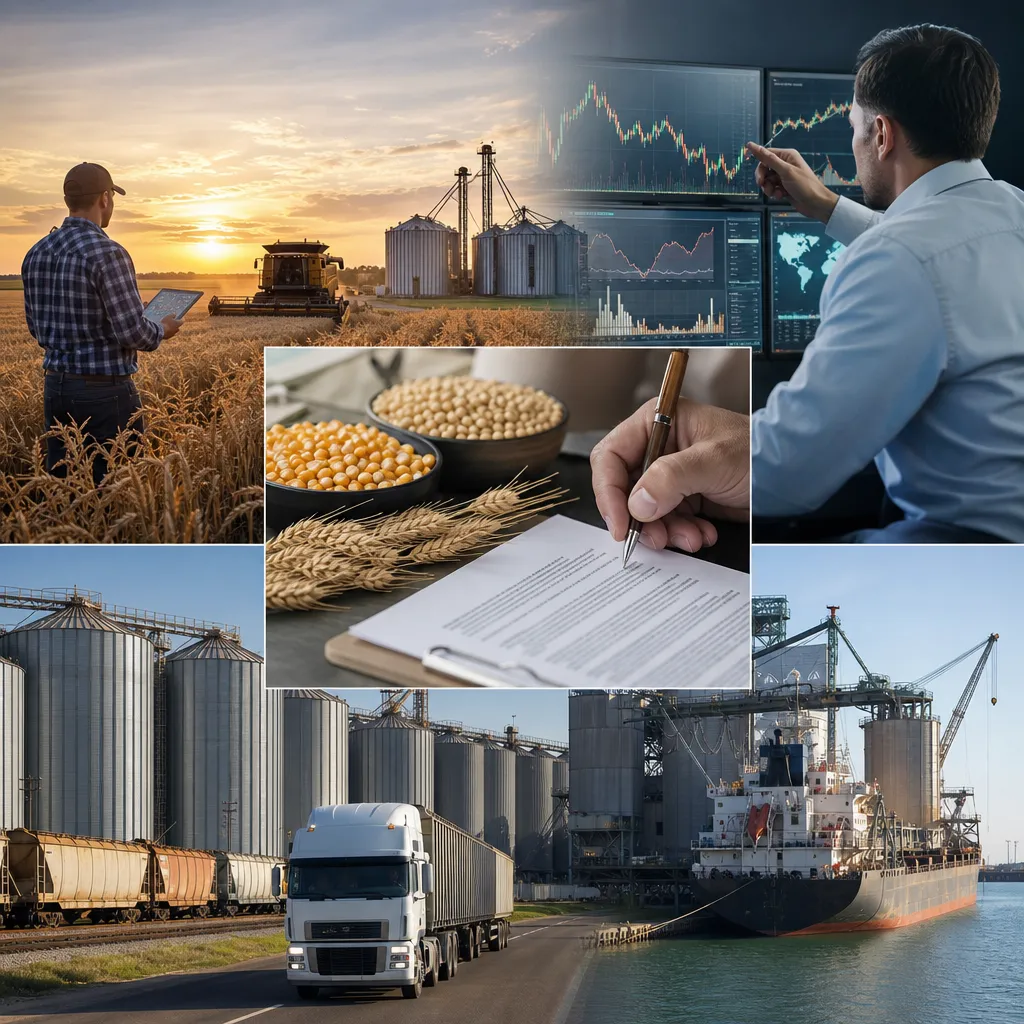




The US grain market is the world’s most closely watched grain pricing system because it combines large crop production, deep domestic consumption, major export flows, and highly liquid futures markets. In practice, “US grain market outlook” usually means the expected direction of corn, soybeans, wheat, and sometimes sorghum, barley, oats, rice, and by-products across both physical and futures markets. The market operates across the entire United States, but price discovery is strongly linked to Midwestern production areas, Gulf and Pacific Northwest export channels, inland river systems, and benchmark futures traded in Chicago and, for some wheat classes, in Kansas City and Minneapolis. Any practical outlook has to distinguish between futures prices seen online and the local cash prices actually paid by elevators, processors, feed mills, ethanol plants, or exporters.
The United States is one of the world’s largest producers and exporters of corn, soybeans, and wheat, so local and global pricing are tightly connected. A farmer in Iowa, an exporter on the Gulf, a feed mill in North Carolina, and an importer overseas may all look at the same benchmark futures market, but they will not pay or receive the same physical price. Differences come from basis, freight, quality, storage, timing, and local competition among buyers.
What the US grain market includes
The US grain market is not one single marketplace. It is a network of physical cash markets, transportation systems, grain handling companies, processors, exporters, and derivatives exchanges. The main commodities watched in the outlook are:
- Corn, heavily used for feed, ethanol, and exports.
- Soybeans, priced as an oilseed but central to grain trade outlooks because of crush demand and export competition.
- Wheat, with several classes and different regional production zones.
- Sorghum, oats, barley, and rice, important in specific regions or end-use markets.
In the United States, physical grain is commonly quoted in US dollars. Futures are usually quoted in cents per bushel on US exchanges, while export trade is often discussed in US dollars per metric ton. Local cash bids in farm areas are often shown in dollars and cents per bushel. This matters because one person may be watching a futures contract online while another is negotiating a delivered price to a feed mill or river terminal.
Where the market operates inside the United States
Production is concentrated in distinct crop belts. Corn and soybeans dominate the Midwest, especially states such as Iowa, Illinois, Indiana, Minnesota, Nebraska, and surrounding areas. Wheat is more geographically diverse, with different classes grown in the Plains, Midwest, and Northern states. Rice has a more regional footprint, and sorghum is particularly relevant in parts of the Plains.
The physical market relies on several logistics corridors:
- Interior elevator networks in producing states.
- Rail shipments to domestic users and export terminals.
- Barge movement through the inland river system toward the Gulf.
- Truck delivery to local elevators, feed mills, ethanol plants, crushers, and flour mills.
- Export loading mainly through the US Gulf and the Pacific Northwest, with other regional channels also relevant.
The result is that “the US price” is really a map of connected local markets. Grain in central Illinois, western Kansas, the Mississippi River corridor, and the Pacific Northwest may all trade off the same broad benchmark but with very different local values.
How US grain prices are formed
US grain prices are formed through the interaction of futures markets and physical cash markets. The benchmark futures market for corn, soybeans, soybean products, and soft red winter wheat is the Chicago Board of Trade, part of CME Group. Hard red winter wheat futures are associated with Kansas City, and spring wheat futures are associated with Minneapolis.
However, futures are only one layer of price formation. In the physical market, a buyer applies a basis to the benchmark futures contract. Basis is the local cash difference versus futures. It may be positive or negative depending on local supply, demand, freight, storage pressure, and buyer competition.
| Price type | Where quoted | What it means |
|---|---|---|
| Futures price | Exchange screen, usually CME Group markets | Benchmark financial price for a standardized contract month, not the exact local farm-gate value |
| Local cash bid | Elevator, cooperative, processor, ethanol plant, crusher, mill | Actual nearby purchase bid for physical grain at a specific location and quality |
| Delivered price | Contract or buyer quote | Price for grain delivered to a named destination, incorporating transport obligations |
| Export bid | Merchant or terminal market | Price linked to export demand, often at river, rail, or port position |
| FOB price | Export trade | Free on board vessel or port loading point; excludes ocean freight after loading |
| CIF price | Import trade | Cost, insurance, and freight to destination; more relevant to importers than to inland US sellers |
Quality also matters. Protein, moisture, test weight, foreign material, damage, and grade can all change the final price. So can timing. At harvest, local bids often come under pressure if storage is tight and many sellers are moving grain at once. Later in the season, basis may strengthen if nearby supply becomes less available.
What drives the US grain market outlook
An outlook is best expressed as a set of scenarios rather than a single prediction. The major drivers are well known, but their influence changes through the crop year.
- Acreage and planting pace: shifts between corn, soybeans, and wheat can alter expected supply.
- Weather: planting conditions, summer heat, rainfall, drought, frost risk, and harvest weather all affect yields and quality.
- Crop condition and yield expectations: these shape market sentiment long before combines enter fields.
- Domestic demand: feed use, ethanol margins, soybean crush demand, and flour milling all matter.
- Exports: competitiveness versus Brazil, Argentina, the Black Sea region, Canada, Australia, and others can move prices.
- Stocks and storage: tighter carryout generally supports price sensitivity.
- Freight and logistics: river levels, rail service, export capacity, and port congestion can move basis even when futures are stable.
- Currency trends: a stronger or weaker US dollar can affect export competitiveness.
- Policy and biofuels: renewable fuel demand, trade policy, and regulatory changes can alter consumption patterns.
In practical terms, a bullish futures outlook does not always mean bullish local cash prices everywhere. A region with large harvest pressure or transportation bottlenecks may still see weak basis. Conversely, a processor or exporter needing grain quickly may bid aggressively even if the broader futures board is quiet.
| Scenario | Typical conditions | Likely market implication |
|---|---|---|
| Tight supply scenario | Weather losses, lower yields, slow farmer selling, strong demand | Futures can strengthen; basis may also firm in deficit areas or active processor zones |
| Large crop scenario | Favorable weather, high yields, strong harvest movement | Futures may weaken; harvest basis often softens where storage and logistics are stressed |
| Export-led support scenario | Competitive US origin, active vessel loading, strong overseas buying | Export basis and nearby demand can improve, especially near river and port channels |
| Domestic-demand support scenario | Strong crush, ethanol, feed, or milling demand | Interior basis can outperform export-driven regions |
Where to check US grain prices and market information online
Readers looking for current or near-real-time prices should not rely on a generic “US grain price” headline. They should identify the commodity, the market type, the location, the contract month if it is futures, and the date.
For benchmark futures and contract information, the practical reference point is CME Group. That is where users can identify the relevant futures market for corn, soybeans, soybean meal, soybean oil, and key wheat contracts.
For public outlook, crop, stocks, acreage, export, and balance sheet information, the most important official source is the US Department of Agriculture. In practice, market participants regularly use:
- USDA WASDE for global and US supply-demand outlooks.
- USDA National Agricultural Statistics Service for acreage, production, stocks, and crop progress data.
- USDA Foreign Agricultural Service Export Sales for export demand signals.
- USDA Agricultural Marketing Service for many cash market and transportation reports.
For local cash bids, the most practical sources are usually:
- Elevator and cooperative bid sheets
- Processor buying bids, such as those from ethanol plants, soybean crushers, flour mills, or feed mills
- Merchants and exporters for river, rail, or terminal positions
- Broker and market data platforms used by traders and commercial firms
A key point is that a futures quote on a screen is not the exact cash price available at a farm, river terminal, or port. The local buyer’s basis, quality schedule, and delivery terms determine the actual transaction value.
How physical grain is actually bought and sold in the United States
Most physical grain in the United States moves through commercial channels rather than through an exchange delivery process. Farmers usually sell to local elevators, cooperatives, processors, feed manufacturers, flour mills, or grain merchandisers. Larger commercial firms may buy from country elevators and move grain by truck, rail, or barge toward domestic users or export positions.
Common physical trading methods include:
- Spot or cash sale: grain is sold for nearby delivery at the buyer’s current bid.
- Forward cash contract: price and delivery period are agreed in advance for future physical delivery.
- Basis contract: the basis is fixed now, while the futures component is priced later.
- Hedge-to-arrive type structures: the futures component is set first and basis is fixed later, subject to buyer terms.
- Delayed pricing or storage arrangements: used in some commercial relationships, with important pricing and credit implications.
Before selling, participants normally confirm grain quality specifications, delivery window, scale and grading procedure, discount schedules, payment timing, and counterparty reliability. In other words, physical grain trading is a contract and logistics business as much as a pricing exercise.
How futures and options are used for trading and hedging
Futures and options do not replace the physical market; they help manage price risk. A farmer, elevator, crusher, feed manufacturer, exporter, or speculative trader can use futures through a brokerage account. They do not need to own or handle grain to trade the contract financially, and most financial users offset their position before expiry rather than making or taking delivery.
The main practical uses are:
- Hedging: a physical holder of grain sells futures to reduce downside price risk, or a future buyer of grain buys futures to protect against rising prices.
- Options: used to manage risk with asymmetric exposure, often at the cost of an option premium.
- Speculation: traders express a view on price direction, spreads, volatility, or relative value.
Users must understand margin, leverage, contract expiry, and basis risk. A hedge can protect against broad futures price moves while still leaving local basis exposure. That is why many commercial firms manage futures and physical basis separately.
Exports, import competition, and the role of US ports
The United States is a major export origin for corn, soybeans, and wheat, so export channels are central to the market outlook. The US Gulf is especially important for shipments moving through the river system, while the Pacific Northwest is a major route for some grain moving west by rail. Export bids in these corridors can influence inland basis, especially when vessel lineups are active or when logistics become constrained.
At the export level, grain may be discussed in terms such as FOB values, origin competitiveness, freight spreads, and destination demand. Exporters buy inland grain, assemble and condition it, manage freight and timing risk, and sell to overseas importers, trading houses, or end users. Import demand from major consuming countries can therefore affect bids far upstream in the US interior.
The United States is not only an exporter in all circumstances. Certain products, qualities, or regional needs can involve imports or cross-border flows, particularly with close trading partners. Even then, benchmark pricing inside the United States remains heavily connected to domestic futures and basis relationships.
Practical outlook: what market participants should watch
For a useful US grain market outlook, watch the market in layers rather than as a single number.
- First, track the relevant futures benchmark for the commodity and crop year.
- Second, monitor USDA supply-demand reports and crop progress updates.
- Third, compare local cash bids and basis in your own region.
- Fourth, follow export demand, river conditions, rail performance, and processor margins where relevant.
- Fifth, separate short-term seasonal pressure from longer-term balance sheet changes.
For producers and physical users, basis and logistics often matter as much as the board. For traders using futures, the core issue is how market expectations are shifting before official data confirms them. For exporters and import-sensitive buyers, competitiveness versus other origins is often the decisive factor.
Where can I check current US grain prices?
Use CME Group for benchmark futures, USDA for official market reports, and local elevators, cooperatives, processors, or merchants for actual cash bids. The right source depends on whether you need futures, local cash, or export market information.
What is the main benchmark for US grain pricing?
For many grains and oilseeds, the main benchmark is Chicago futures through CME Group, especially for corn, soybeans, and soft red winter wheat. Other wheat classes are linked to Kansas City and Minneapolis benchmarks.
Why is my local cash price different from the futures price?
Because cash price equals the futures reference plus or minus local basis, adjusted for quality, freight, timing, and buyer demand. A futures quote is not the same as a farm-gate or delivered physical price.
How is physical grain usually sold in the United States?
Most physical grain is sold to elevators, cooperatives, processors, mills, feed companies, or exporters under cash, forward, basis, or other commercial contracts. It is not normally sold by a farmer directly through the futures exchange.
Can someone trade US grain futures without owning grain?
Yes. Futures and options are financial instruments that can be traded through a broker. Many participants are hedgers, but others are speculators or spread traders who have no intention of making or taking physical delivery.
Which US export regions matter most for grain?
The US Gulf and the Pacific Northwest are especially important export corridors. Inland river systems and rail networks connect producing regions to those export routes and strongly affect basis.
What units are normally used in the US grain market?
Domestic futures and many cash bids are commonly quoted in cents or dollars per bushel, while export trade is often discussed in US dollars per metric ton. Users should always confirm the unit before comparing prices.
What are the biggest risks to the US grain outlook?
Weather, acreage shifts, yields, export demand, ethanol and crush margins, logistics disruptions, currency changes, and policy developments are among the most important risks. Their effect can differ sharply by region and commodity.
Sources
- US Department of Agriculture
- CME Group
- US Department of Agriculture Agricultural Marketing Service