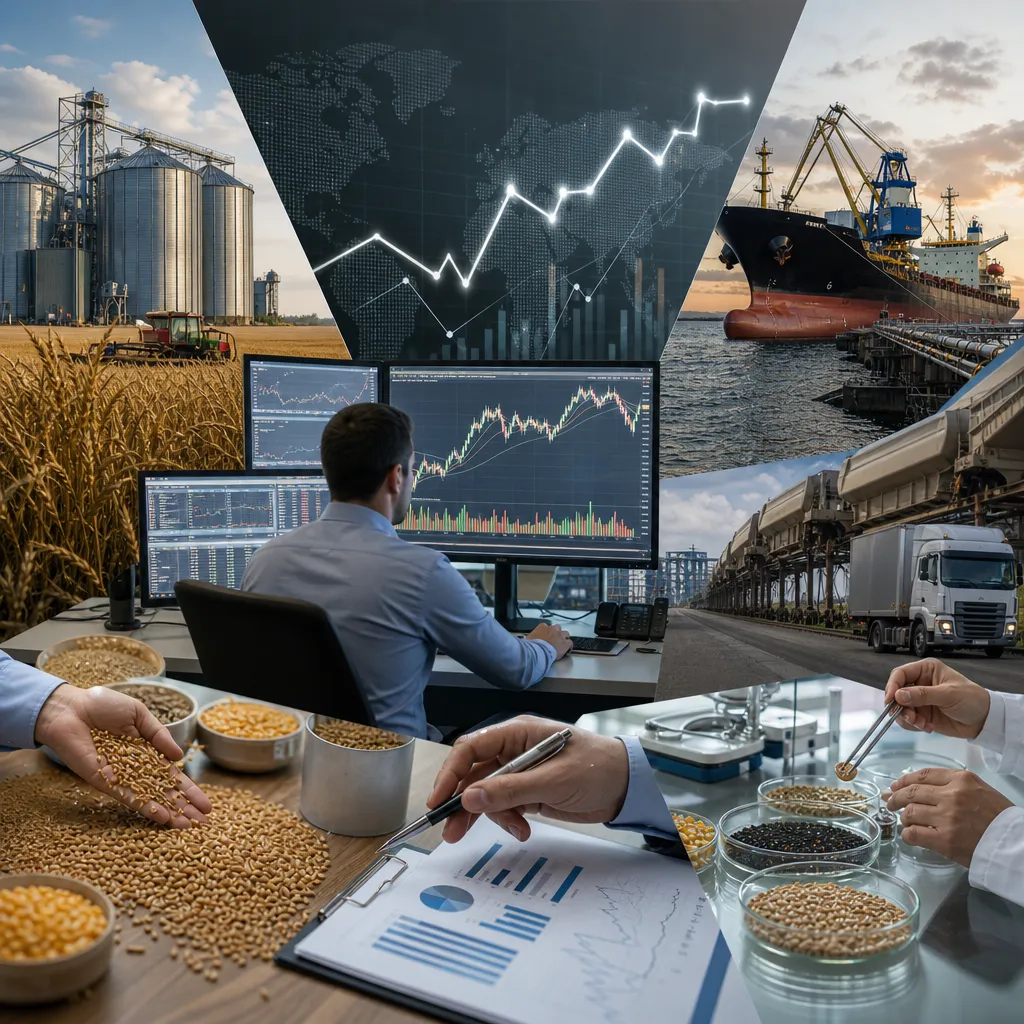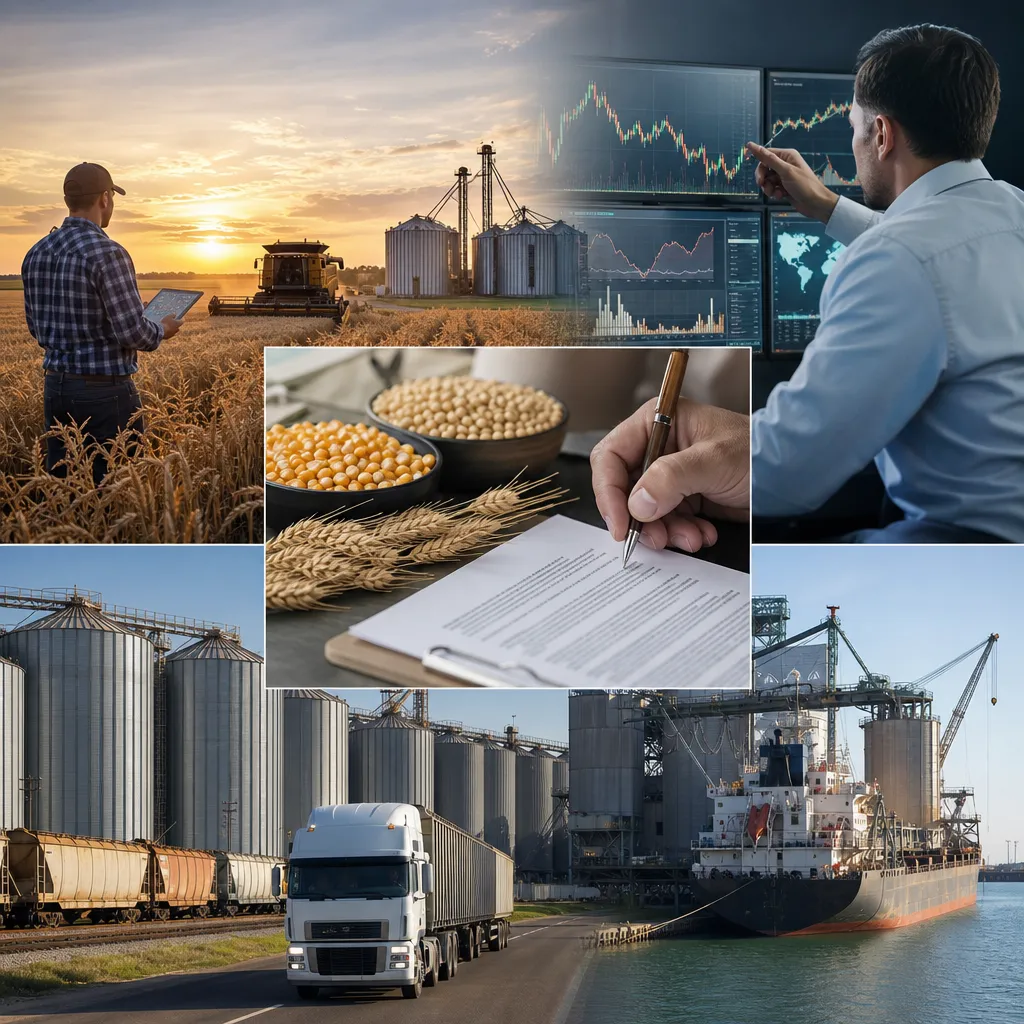
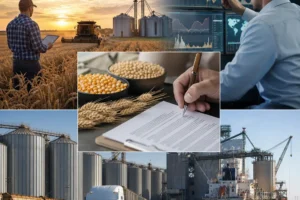
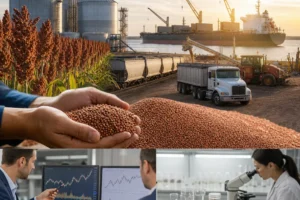

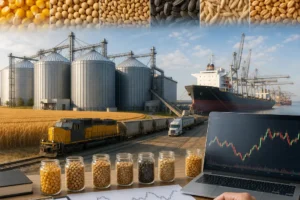

Grain supply and demand outlook is the practical framework used to judge whether prices are more likely to be supported, pressured, or volatile over the coming weeks and months. In grain markets, outlook does not mean a single prediction; it means tracking the balance between production, stocks, trade flows, and end-user consumption, then testing how weather, policy, logistics, and currency shifts could change that balance. Farmers, grain buyers, processors, exporters, and futures traders all use the same core question: will available supply be comfortable, tight, or tightening relative to demand? The answer is built from public crop reports, exchange prices, local cash bids, export data, and what is happening physically at elevators, ports, and processing plants.
What a grain supply and demand outlook actually measures
A grain outlook is usually organized crop by crop: wheat, corn, soybeans, rice, barley, oats, rye, sorghum, canola or rapeseed, and sunflower seed. For each crop, market participants watch four basic building blocks: production, beginning stocks, trade, and consumption. These combine into ending stocks, which are the main buffer between a comfortable market and a tight one.
The most common way to think about it is simple:
- Supply = beginning stocks + new crop production + imports
- Demand = domestic use + exports
- Ending stocks = supply minus demand
If production rises but exports and feed use rise even more, the market can still tighten. If a crop is large but quality is weak, usable supply for milling or food processing may still be limited. That is why outlook work must go beyond headline harvest size.
The other key measure is stocks-to-use, which compares ending stocks with total demand. A low stocks-to-use ratio usually means the market has less margin for weather problems, freight disruption, or policy shocks. A high ratio usually means the market can absorb setbacks more easily.
How the outlook is built in practice
Professional grain analysis usually starts with acreage, yield, and planted-area assumptions. Analysts then adjust for weather, regional crop condition, disease pressure, fertilizer economics, and abandonment risk. On the demand side, they estimate feed use, crush or milling demand, ethanol or biofuel usage, exports, and import needs.
That work happens both online and in the physical market.
Online, the main inputs come from official reports and exchange data. Traders and analysts commonly monitor USDA reports, CME Group futures prices, CFTC positioning data, FAO market information, and national crop agencies or statistical offices.
In the physical market, the same outlook is tested against what elevators, cooperatives, merchants, crushers, mills, feed companies, and exporters are actually doing. If an export program is supposedly strong but interior basis is weak and port lineups are slow, the market may be signaling that demand is less urgent than headline numbers suggest.
In other words, a useful grain outlook is not just a set of spreadsheets. It is a comparison between reported fundamentals and real-world merchandising behavior.
| Factor | Why it matters | How it is checked |
|---|---|---|
| Acreage | Sets the production base before yield is known | Planting surveys, government acreage reports, local field checks |
| Yield | Largest driver of total crop size in many regions | Crop condition reports, weather models, field tours, harvest results |
| Beginning stocks | Determines how much old-crop buffer exists | Stocks reports, warehouse data, balance sheets |
| Exports | Can tighten markets quickly in surplus-exporting regions | Export sales, customs data, port activity, vessel lineups |
| Domestic use | Feed, food, crush, and biofuel demand often move slower but matter greatly | Processor margins, feed demand, crush data, ethanol indicators |
Main drivers by crop
Different grains react to different demand channels and different competing suppliers.
- Wheat: sensitive to Black Sea exports, quality spread between milling and feed wheat, import demand in North Africa and the Middle East, and weather in major exporters.
- Corn: strongly influenced by feed demand, ethanol or industrial use, export competition, and weather during pollination and grain fill.
- Soybeans: highly linked to crush demand, soybean meal and oil markets, biofuel policy, and Chinese import demand.
- Rice: affected by government policy, food security measures, export restrictions, and quality preferences in destination markets.
- Barley, oats, rye, sorghum: often more regional, with freight, feed substitution, and niche end-use demand playing larger roles.
- Canola, rapeseed, sunflower seed: closely tied to vegetable oil demand, crush capacity, and weather during flowering and pod fill.
Substitution matters. If wheat becomes cheap relative to corn, some feed rations may shift. If soybean meal becomes expensive, buyers may reduce inclusion rates or use alternative protein feeds where possible. That means no grain outlook should be built in isolation.
Where to find grain supply and demand data
The most widely used official source for global grain balance sheets is the USDA World Agricultural Supply and Demand Estimates, commonly called WASDE. It provides production, trade, use, and ending-stocks estimates for major crops and countries. Analysts use it as a benchmark, not as the only truth.
For U.S. market participants, several USDA publications matter:
- WASDE for broad global and U.S. balance sheets
- Crop Progress for weekly planting and crop-condition updates
- Grain Stocks for quarterly inventory estimates
- Acreage and production reports for planted and harvested area
- Export Sales for weekly demand signals
For futures pricing and contract information, readers usually check CME Group for benchmark U.S. grain and oilseed contracts such as corn, wheat, soybeans, soybean meal, soybean oil, oats, and related derivatives. These are exchange-traded financial contracts. They are not the same as the local cash price at a country elevator.
For speculative and hedge-fund positioning, the CFTC Commitments of Traders report is important. It shows how broad classes of participants are positioned in futures and options markets. It does not show physical grain ownership, but it helps explain price momentum and liquidation risk.
For global context, FAO provides international food and commodity market information, especially useful for readers comparing grain markets across importing and exporting regions.
Outside the U.S., national agriculture ministries, crop boards, statistical agencies, customs databases, and exchange operators may provide regional production and trade data. In practice, many merchants combine these public reports with paid private weather models, satellite crop monitoring, and freight intelligence.
| Source type | What it provides | Who uses it |
|---|---|---|
| USDA balance-sheet reports | Production, use, trade, ending stocks | Farmers, merchants, analysts, futures traders |
| Exchange data | Futures prices, contract specs, volume, expiry | Hedgers, brokers, speculators, risk managers |
| CFTC positioning data | Market positioning in listed contracts | Traders, analysts, macro funds |
| Local elevators and cooperatives | Cash bids, basis, delivery terms, storage programs | Farmers, local buyers, merchandisers |
| Ports, exporters, processors | Physical demand signals, spreads, freight tension | Commercial traders, logistics teams, originators |
Futures prices versus local cash grain prices
This distinction is essential for any supply and demand outlook.
Futures prices are quoted on regulated exchanges such as CME Group. They represent standardized contracts for a future delivery month, with contract specifications, delivery locations, and quality rules defined by the exchange. These contracts are traded through a futures broker and require a brokerage account, margin funding, and an understanding of leverage and expiry.
Cash prices are the prices actually offered in the physical market by elevators, cooperatives, processors, mills, feed manufacturers, merchants, or exporters. A local bid reflects:
- the relevant futures month, if a futures benchmark is used,
- basis, which is the local cash adjustment to futures,
- quality and grade,
- delivery point and freight,
- storage conditions and timing,
- local supply pressure and nearby buyer demand.
A farmer normally checks local bids through elevator websites, cooperative bid sheets, merchant bid lines, direct communication with a grain buyer, or regional market reporting services. A processor may post prices online but still negotiate for volume, freight, or quality. In export channels, basis can also move because of rail capacity, barge availability, vessel lineups, or congestion at port.
So when reading a bullish or bearish grain outlook, the practical question is not only whether futures might move, but whether local basis is likely to strengthen or weaken as well.
How weather, logistics, and policy change the outlook
Weather is often the fastest-moving variable, but its market effect depends on crop stage. Dryness during emergence does not carry the same pricing impact as dryness during pollination or grain fill. Excess rain near harvest may hurt quality more than volume, which can widen premiums for higher grades even if total tonnage remains large.
Logistics also changes supply and demand in ways balance sheets can miss. Grain may exist in the country, but if rail is delayed, river draft is limited, truck availability is poor, or port handling is congested, nearby buyers may bid up for prompt supply while distant markets remain softer. This is why basis and spreads often tell an important story.
Government policy can matter as much as weather, especially in export-oriented grains. Examples include export restrictions, biofuel mandates, tariff changes, sanitary rules, reserve releases, and currency intervention. These measures can shift trade flows quickly, particularly in wheat, rice, and vegetable-oil-related crops.
Energy and fertilizer costs also feed into outlook analysis. They influence planted area decisions, drying costs, transportation economics, and crush or ethanol margins. In a high-cost environment, supply response may be slower even if prices improve.
How farmers, buyers, and traders use the outlook
Farmers use supply and demand outlooks to decide when to make cash sales, whether to store grain, whether to use forward contracts, and whether futures or options hedging is justified. The outlook helps answer whether the market is paying for storage, whether basis is likely to improve, and whether downside price risk outweighs upside potential.
Elevators, cooperatives, and merchants use the outlook to set bids, manage basis exposure, hedge inventory, and plan origination. They are active in both the physical and futures markets, but the two functions are separate: physical grain is bought and sold through commercial contracts, while futures are commonly used to manage price risk.
Processors such as mills, crushers, maltsters, and feed companies use the outlook to secure coverage and protect margins. They may buy physical grain forward from growers or merchants, hedge input costs through futures, and monitor quality availability by region.
Speculators and fund traders use the outlook mainly through futures and options. They do not need storage or delivery capacity if they close or roll positions before delivery. However, they still need a regulated brokerage relationship, margin capital, and clear risk controls.
Using the outlook for hedging, storage, and physical sales
In practice, the outlook becomes most useful when turned into a decision process.
- Check the benchmark market: identify the relevant futures contract month and exchange if the crop is priced off a listed benchmark.
- Check local bids: compare elevator, cooperative, processor, or merchant bids rather than relying on futures alone.
- Assess basis: decide whether your local market is strong or weak relative to futures and recent history.
- Review storage economics: include shrink, aeration, interest on inventory, quality risk, and any commercial storage charges.
- Match quality to outlet: milling wheat, malting barley, food-grade oats, or non-GMO soybeans may require tighter specs and different buyers.
- Choose a risk tool: cash sale, forward contract, hedge-to-arrive contract where offered, futures hedge, or options strategy.
Physical sales normally happen through elevators, cooperatives, grain merchants, brokers, processors, or direct end-user contracts. The key commercial details are delivery window, grade and quality, moisture, discounts, freight responsibility, weighing and inspection, and payment timing. Cross-border trade may add Incoterms, customs clearance, phytosanitary requirements, and foreign-exchange risk.
Storage can be on-farm or commercial. On-farm storage gives timing flexibility but puts quality control and aeration responsibility on the owner. Commercial storage may improve market access but adds charges and may reduce flexibility during congested periods. A bullish futures outlook does not automatically justify holding grain if basis is weak and carrying costs are high.
Limits and common mistakes in grain outlook analysis
No outlook is final. Grain markets reprice constantly as harvest advances, export demand changes, and weather forecasts shift.
Common mistakes include:
- treating a large crop as bearish without checking demand growth,
- ignoring quality differences within the crop,
- confusing futures quotes with farmgate cash prices,
- using one government report as the only source of truth,
- ignoring logistics, basis, and freight,
- assuming exports will continue at the same pace without checking competitiveness and currency moves.
The best grain outlook is scenario-based. A practical analyst asks what happens if acreage is higher, if yield slips, if exports slow, or if policy changes. That approach is more reliable than trying to force certainty from incomplete information.
Where can I check grain supply and demand outlook reports?
The main public starting points are USDA balance-sheet and crop reports, CME Group contract information for benchmark futures, and CFTC positioning reports. For global context, FAO and national agriculture ministries or statistical agencies are also important. Commercial analysts often add paid weather, freight, and regional cash-market services.
Where do farmers usually check grain prices?
Farmers usually check local elevator, cooperative, merchant, or processor bids, often through bid sheets, websites, text services, or direct contact with grain buyers. They may also watch exchange futures prices, but futures are only the benchmark component of price where that benchmark is used. The final cash bid includes basis, quality, and delivery terms.
Can I trade a grain outlook online without buying physical grain?
Yes, through regulated futures and options markets accessed via a futures broker. That is financial trading, not physical grain ownership. You need a brokerage account, margin funding, and an understanding of leverage, contract size, expiry, and the risk of loss.
How is physical grain actually bought and sold?
Usually through elevators, cooperatives, merchants, processors, exporters, mills, feed companies, or brokers. The transaction includes quantity, quality, delivery point, timing, freight responsibility, inspection terms, and payment terms. In many markets, bids can be posted electronically, but the grain still moves through physical logistics and warehouse systems.
Why can local cash prices move differently from futures?
Because local cash prices reflect basis, which responds to nearby supply, buyer demand, freight, storage pressure, rail or barge issues, and quality availability. Futures may fall while local basis strengthens, or futures may rise while local basis weakens. That is common during harvest, logistics disruptions, or regional supply shortages.
What reports matter most during the growing season?
Crop condition updates, acreage reports, weather forecasts, and export demand reports usually matter most. Later, yield verification, harvest pace, grain quality, and stocks data become more important. The relevant report depends on whether the market is focused on production risk, demand risk, or inventory tightness.
Is storing grain always a bullish strategy?
No. Storage only makes sense if the likely price improvement or basis improvement exceeds carrying costs and quality risk. Those costs may include interest, handling, shrink, aeration, commercial storage charges, and possible quality deterioration. Storage is a merchandising decision, not just a market view.
Sources
- USDA World Agricultural Supply and Demand Estimates
- CME Group agricultural futures and options contract information
- U.S. Commodity Futures Trading Commission Commitments of Traders