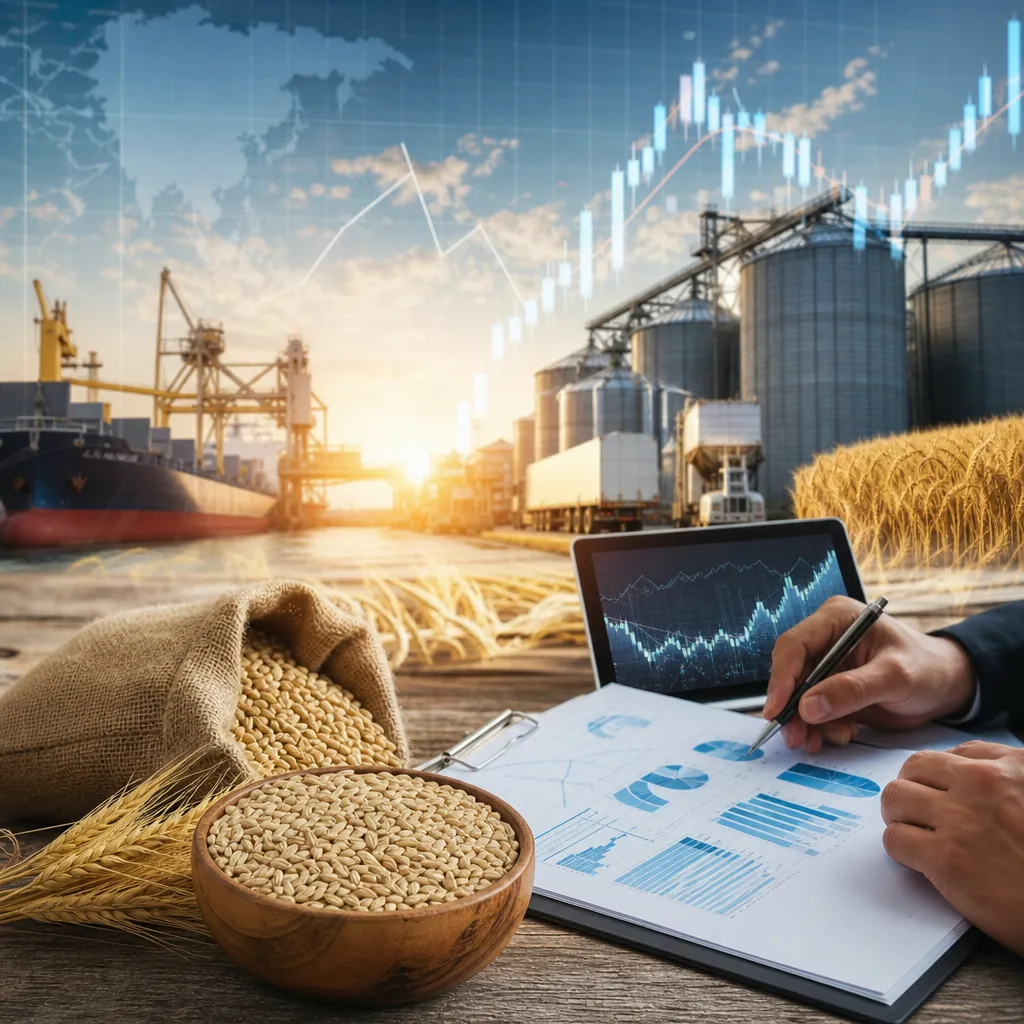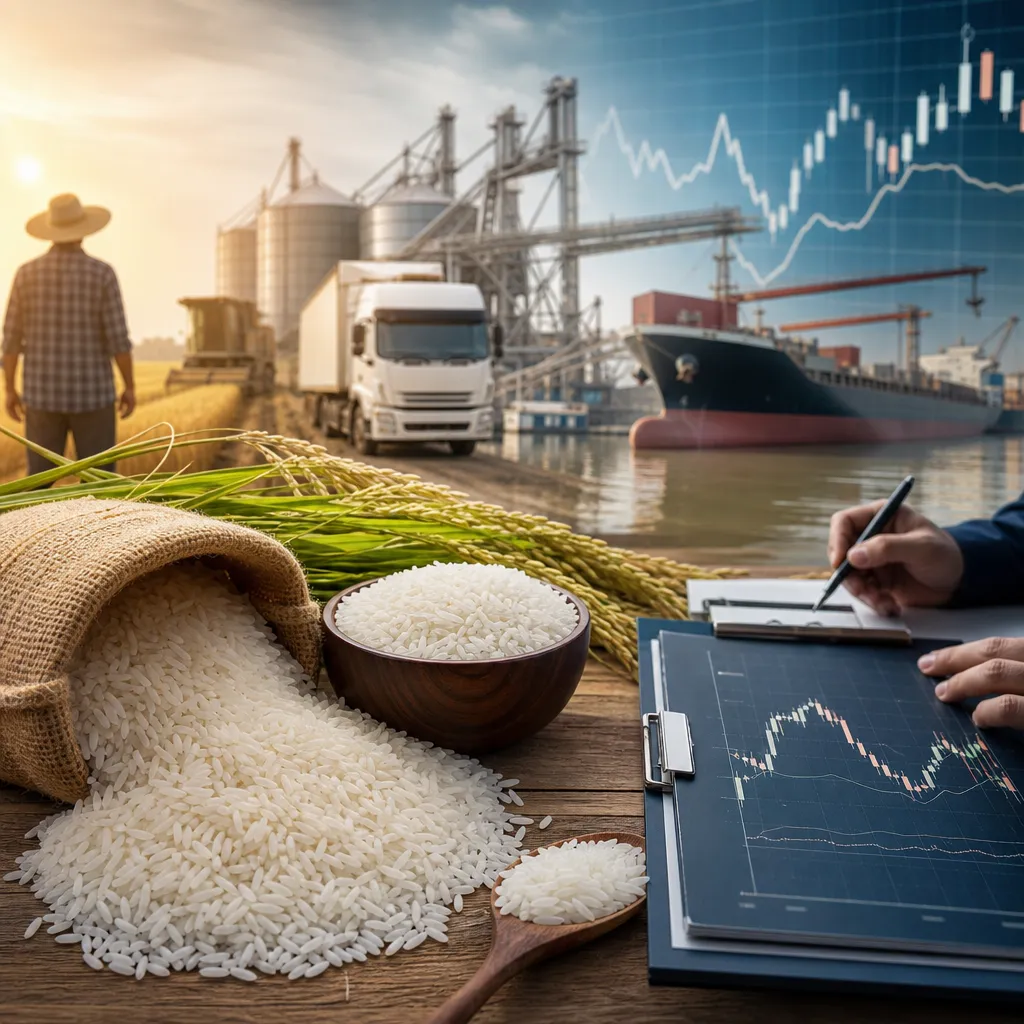






A grain price forecast is not a single number. It is a structured view of how futures prices, local cash prices, and basis may change under different supply, demand, weather, currency, and logistics scenarios. The most practical way to use a forecast is to combine exchange market signals with local elevator bids, government crop reports, and your own storage, freight, and financing costs. That matters because the price quoted on a futures screen is not automatically the price a farmer receives or a buyer pays in the physical grain market.
For most crops, price direction is built from a few repeatable questions: how much acreage was planted, what yield is likely, how large beginning stocks are, how strong domestic use and exports may be, and whether transport or policy disruptions could tighten nearby supply. Wheat, corn, soybeans, rice, barley, oats, rye, sorghum, canola, rapeseed, and sunflower seed all respond to these drivers, but not in the same way or in the same region. A useful forecast therefore starts with the benchmark market and then narrows to the local physical market where grain is actually bought, sold, stored, or processed.
In practice, readers usually check futures quotations on exchange websites or broker platforms, then compare them with local bids posted by grain elevators, cooperatives, merchants, crushers, feed mills, exporters, or processors. Analysts add official data from agencies such as USDA, CFTC, FAO, and national statistical or agricultural ministries. The forecast becomes actionable only when those public signals are translated into local cash price expectations, basis risk, and a specific marketing decision.
How grain price forecasts work
Grain price forecasting is scenario analysis, not certainty. A market participant tries to estimate how the balance between supply and demand may shift, then asks how that shift could affect futures prices and local cash values. This process is used by farmers deciding when to sell, feed companies planning input purchases, millers and crushers managing coverage, merchants evaluating basis opportunities, and speculators trading futures or options.
The core mechanics are straightforward:
- Start with a benchmark market price, usually an exchange-traded futures contract for corn, wheat, soybeans, canola, or another major grain or oilseed.
- Assess crop fundamentals such as planted area, crop condition, yield risk, ending stocks, and domestic consumption.
- Track demand indicators including exports, livestock feed demand, ethanol or biodiesel use, and processor margins where relevant.
- Adjust for non-crop influences such as currencies, energy prices, interest rates, policy decisions, and freight.
- Translate the benchmark into a local cash expectation by estimating basis, logistics, quality discounts or premiums, and storage costs.
The local part is where many forecasts fail. If river levels are low, rail service is tight, a port is congested, or a crusher needs immediate nearby supply, local prices may behave very differently from the futures board. A good forecast therefore always separates flat price risk from basis risk.
Where grain prices are quoted and where to check them
There are two main price layers: exchange futures prices and physical cash prices. They are related, but they are not the same market.
| Price type | Where it is found | What it represents | Who uses it |
|---|---|---|---|
| Futures price | Commodity exchange data, broker platforms, market terminals | Standardized contract price for a specific delivery month | Traders, hedgers, analysts, merchandisers |
| Cash bid | Elevators, cooperatives, merchants, processors, local market reports | Actual local buying price at a named delivery point and quality spec | Farmers, feed mills, nearby buyers, grain merchants |
| Export or port price | Export offers, merchant indications, port market intelligence, trade reports | Price for grain delivered to port or export channel | Exporters, importers, large merchants, shipping participants |
| Forward contract price | Offered directly by elevator, merchant, cooperative, processor | Future delivery cash price or basis tied to contract terms | Farmers, commercial buyers, processors |
For benchmark futures, the relevant exchange depends on the crop and region. CME Group is central for many globally watched grain and oilseed contracts, especially corn, wheat, soybeans, soybean meal, and soybean oil. ICE is important for canola futures in Canada. Other exchanges may matter regionally where wheat, rapeseed, rice, or feed grain contracts are traded and used as price references.
For local cash prices, the usual places to check are grain elevator bid sheets, cooperative postings, processor bid pages, merchant bid lists, local farm market apps, and public agricultural market reporting systems where available. In many countries, official agencies or state-level market news services publish spot prices, terminal market prices, or regional cash indicators. Those are often more relevant for physical decisions than a headline futures quote.
Main drivers behind a grain price forecast
Most grain forecasts can be organized around a short list of variables. The importance of each factor changes by crop, season, and country.
| Driver | Typical price effect | How analysts check it |
|---|---|---|
| Acreage | More planted area can pressure prices if yield is normal | Planting surveys, government acreage reports, satellite analysis |
| Yield and weather | Poor weather can tighten supply and support prices | Crop condition reports, rainfall and temperature maps, private weather models |
| Stocks | Low ending stocks usually increase sensitivity to weather or demand changes | Balance sheets, stocks reports, stocks-to-use calculations |
| Exports and imports | Strong exports can tighten domestic availability | Export sales, customs data, shipment inspections, port lineups |
| Currency | A weaker exporter currency can improve competitiveness | FX markets, central bank policy, trade competitiveness analysis |
| Energy and biofuels | Higher fuel and biofuel demand can support corn, oilseeds, and byproducts | Energy markets, crush margins, ethanol and biodiesel indicators |
| Freight and logistics | Transport constraints can widen basis and distort local price signals | Rail, barge, truck, and port market intelligence |
Weather deserves special attention because its effect changes during the crop calendar. Early-season dryness may affect emergence and acreage decisions. Mid-season heat can damage yield potential. Harvest rain can reduce quality and increase discounts for test weight, falling number, mold, or damage, especially in wheat and barley.
For oilseeds such as canola, rapeseed, and sunflower seed, analysts also watch crushing demand, vegetable oil markets, and policy around renewable fuels. For rice, irrigation availability, government intervention, and export policies can strongly influence price formation. For sorghum and barley, feed substitution and trade flows often matter as much as production.
How futures, options, and basis shape a forecast
Exchange-traded futures are standardized contracts for future delivery months. They are used for price discovery and risk transfer. A farmer or grain buyer can use them to hedge price exposure, while a speculator may trade them without intending to handle physical grain.
To trade futures or options, a participant normally needs an account with a regulated futures broker or futures commission merchant, depending on jurisdiction. Trading is done on the exchange market through that intermediary. This is different from selling grain to an elevator or contracting physical grain with a mill, crusher, feed company, or exporter.
Options add flexibility by giving the right, but not the obligation, to buy or sell futures at a specified strike price. They are often used to set a minimum or maximum price zone while preserving some upside or downside participation. However, they still involve time decay, premium cost, and market complexity.
A practical grain forecast should include these market layers:
- Futures outlook: whether the broader benchmark market looks tight, balanced, or oversupplied.
- Basis outlook: whether local supply, processor demand, freight, or storage pressure may strengthen or weaken local bids relative to futures.
- Carry structure: whether later futures months trade above nearby months enough to justify storage after interest, shrink, and handling costs.
Basis risk is the key limitation. A producer can hedge futures and still see an unfavorable cash result if local basis weakens. A feed mill can lock board exposure and still face higher delivered cost if freight tightens or quality premiums rise. That is why merchandisers focus not only on the board, but also on local spreads, freight, and delivery point economics.
Where forecasts are built from: reports, data, and market tools
Reliable grain forecasting usually starts with public official data, then adds commercial market intelligence. The most widely used public sources are well known because they provide consistent crop, stocks, trade, and market positioning information.
USDA is a central source for global and U.S. grain analysis. Its WASDE report gives balance sheet estimates for production, use, trade, and ending stocks. Crop Progress tracks seasonal condition and planting or harvest pace. Export Sales and grain inspections help monitor demand and shipment flow. Grain Stocks and acreage reports are especially market-sensitive at key times of year.
CFTC provides Commitments of Traders data, which shows how different categories of market participants are positioned in certain futures and options markets. It does not forecast price by itself, but it helps readers understand whether funds, commercial hedgers, or other participants are heavily long or short.
CME Group provides contract specifications, settlement information, futures and options references, and educational material on how grain contracts work. This is where a reader confirms contract size, delivery month structure, price unit, and other mechanics before using futures data in a forecast.
FAO and national agriculture ministries or statistical offices are useful for international production and trade context, especially outside the United States. Customs and trade databases may also help assess import and export flows, though they may be less timely than weekly market reports.
Commercial tools can add real-time quotes, charting, weather analytics, satellite imagery, basis mapping, and farm marketing workflows. It is important to distinguish among them:
- Market-data platforms provide prices, charts, and sometimes news.
- Broker platforms are used to place futures or options trades.
- Physical grain marketplaces or merchant systems facilitate bids, offers, or contracts for actual grain.
- Farm and grain management software helps track inventory, contracts, storage, and marketing plans.
Not every tool includes every function, and access terms depend on provider and country. Before relying on a software platform, readers should verify the source of its prices, whether they are delayed or real-time, and whether local cash bids come directly from participating buyers.
Forecasting the physical market: elevators, processors, exporters, and storage
Physical grain price forecasting is more than guessing the board direction. A real transaction happens at a named location, on a specified date range, for a defined grade and moisture standard, with freight and payment terms that affect the final net price.
A typical physical grain transaction may involve:
- A farmer, warehouse holder, or merchant offering grain for spot sale or forward delivery.
- An elevator, cooperative, mill, crusher, feed company, maltster, or exporter posting a bid or requesting offers.
- Negotiation over delivery window, quality specs, freight responsibility, and price structure.
- Settlement by flat cash price, futures plus or minus basis, minimum-price style arrangement where available, or another contract structure.
- Inspection, weighing, grading, unloading, and final payment according to contract terms and local regulation.
Where this happens depends on market structure. In many producing regions, farmers sell to local country elevators or cooperatives. Merchants may aggregate those supplies and move them by truck, rail, barge, or vessel to processors or export terminals. In deficit regions, importers, feed companies, mills, or government agencies may source grain through tenders, merchants, or direct contracts.
Storage changes the forecast because it gives timing flexibility, but it is not free. Forecasting stored grain value requires comparing expected price improvement with carrying costs such as warehouse charges, on-farm bin costs, drying, shrink, interest on inventory, insurance, quality loss risk, and freight timing. A bullish forecast that ignores those costs can still produce a poor marketing result.
Practical forecasting scenarios by market condition
Instead of predicting one exact future price, it is better to build three basic scenarios.
Tight supply scenario
This usually develops when acreage falls, weather damages yield, stocks are already low, or exports outperform expectations. Futures often react first, especially in weather-sensitive months. Local cash markets may move even more if processors or feeders need prompt supply. In this setting, basis can strengthen and inverse markets may discourage storage.
Large crop or surplus scenario
If acreage is high, weather is favorable, and demand growth lags, futures can weaken. Harvest pressure often widens basis as elevators fill space and transport systems become busy. In such a case, the key question is whether carry in the forward curve is large enough to pay storage, financing, and handling costs.
Mixed or dislocated scenario
Sometimes futures are range-bound while local cash markets move sharply because of port congestion, river problems, rail shortages, quality issues, or policy changes. This is common when headline global supply looks adequate but regional logistics are strained. In these periods, local bid monitoring can matter more than broad benchmark price analysis.
How to use a grain price forecast in real decisions
For farmers, a practical forecast should lead to a marketing plan, not just a market opinion. That may mean pre-harvest sales through a cooperative or merchant, post-harvest storage with hedge protection, or incremental sales on rallies rather than waiting for one perfect number. The right method depends on cash flow needs, storage capacity, debt obligations, crop insurance interactions where applicable, and tolerance for basis risk.
For commercial buyers such as feed mills, ethanol plants, crushers, or exporters, forecasting is often used to set coverage policies. They may buy physical grain forward, hedge futures exposure, or use options to protect against upside risk while maintaining procurement flexibility. Their decisions usually reflect not only grain price direction, but also freight, quality needs, and expected processing margins.
For traders and analysts, the most common mistake is mixing markets. A chart on a futures platform may show Chicago corn or wheat, but the physical transaction may be a different protein level, moisture specification, delivery month, currency, or freight basis. Forecasts become more accurate when each layer is clearly identified: benchmark contract, local basis, quality terms, and delivery point.
Where should I check grain prices first?
Check both the exchange benchmark and your actual local market. Futures can be viewed through exchange data or broker platforms, while local cash bids are usually posted by elevators, cooperatives, merchants, processors, or market reporting services. For a physical sale or purchase, the local bid is usually more relevant than the futures headline alone.
What is the difference between a grain futures price and a cash grain price?
A futures price is the value of a standardized exchange contract for a specific delivery month. A cash price is the actual local price for physical grain at a delivery point and quality specification. The difference between them is the basis, which changes with local supply, demand, freight, and storage conditions.
Where does grain trading take place?
Financial grain trading takes place on regulated commodity exchanges through futures brokers. Physical grain trading takes place through elevators, cooperatives, merchants, processors, feed companies, exporters, importers, and sometimes brokers arranging OTC physical deals. These are related markets, but they are not the same transaction channel.
Which reports matter most for grain price forecasts?
USDA WASDE, Crop Progress, Grain Stocks, acreage reports, and Export Sales are among the most watched. CFTC Commitments of Traders helps interpret market positioning. Depending on region and crop, national agriculture ministries, customs data, and official statistics may also be important.
How do I know whether storage is worth it?
Compare the expected improvement in cash price or futures carry with all storage-related costs, including interest, shrink, drying, handling, insurance, and quality risk. If the forward market and likely basis improvement do not cover those costs, storage may not add value even if prices eventually rise.
Can I use futures to hedge grain without delivering physical grain to the exchange?
Yes. Most hedgers offset futures positions before delivery and settle their physical grain separately through local buyers or sellers. Delivery is part of contract design, but many commercial hedgers use futures mainly as a pricing tool rather than as a delivery mechanism.
How should importers or feed buyers use a grain forecast?
They usually combine benchmark futures analysis with freight, currency, and local procurement risk. A good forecast for an importer or feed buyer includes delivered cost, not only commodity value. Port price, vessel timing, inland transport, and quality specs can change the final economics significantly.
Why can local grain prices rise when futures are flat?
Local prices can rise because basis strengthens. Common reasons include short nearby supply, strong processor demand, transport bottlenecks, export pull, or quality shortages. In those cases, the local market tightens even if the wider futures market is not moving much.
Sources
- USDA Foreign Agricultural Service and World Agricultural Outlook Board, WASDE and related grain market reports
- CME Group, grain and oilseed futures and options contract specifications and market data references
- U.S. Commodity Futures Trading Commission, Commitments of Traders