


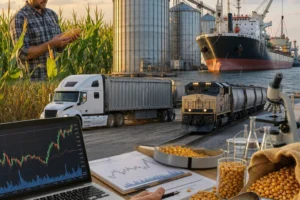




In the United States, “corn prices today” can mean several different things depending on where and how the corn is being traded. A futures quote on the Chicago Board of Trade is not the same as a local elevator cash bid in Iowa, a delivered ethanol plant price in Nebraska, or an export offer at the Gulf. To understand today’s US corn price, readers need to know the market location, the pricing unit, and whether the quote refers to futures, cash, delivered, or export values. In practice, US corn is priced through a chain that links local physical grain markets to national benchmarks, transportation costs, quality terms, and global trade demand.
The United States is one of the world’s major corn producers, consumers, and exporters. Corn is grown heavily across the Corn Belt, including states such as Iowa, Illinois, Nebraska, Minnesota, Indiana, and South Dakota, but prices are shaped nationwide by livestock feed demand, ethanol production, export competition, and futures trading in Chicago. US corn prices are usually discussed in US dollars per bushel in the domestic market, while export trade is often discussed in US dollars per metric ton or on an FOB basis at export terminals.
What “US corn prices today” usually means
There is no single nationwide spot price that perfectly represents all US corn transactions at one moment. Instead, the market is made up of several connected price layers.
- CBOT corn futures: the benchmark paper market used across the US grain trade.
- Local cash bids: prices offered by elevators, cooperatives, feed mills, ethanol plants, and processors in specific towns or regions.
- Delivered prices: prices for corn delivered to a named buyer or facility.
- Export values: prices for corn loaded for shipment from ports, often discussed as FOB Gulf or Pacific Northwest.
- River or terminal bids: inland export-linked prices at barge facilities or major rail terminals.
For a reader looking for today’s price, the first step is to identify the market. A farmer in central Illinois will care most about a nearby elevator bid or processor bid. A trader hedging risk may look first at the nearby or new-crop CBOT contract. An overseas buyer may watch US Gulf export offers rather than interior cash bids.
Where the US corn market operates
The US corn market operates through both physical grain channels and financial exchanges. The benchmark futures market is centered on CME Group’s Chicago Board of Trade, where corn futures and options are traded electronically. That market provides price discovery and hedging tools, but most farmers and commercial users still transact physical grain through local buyers.
The main physical market zones include:
- Corn Belt farm markets: country elevators, cooperatives, feed mills, and ethanol plants.
- River markets: Mississippi, Illinois, Ohio, and other river locations where grain moves by barge.
- Rail markets: shuttle-loading facilities and terminal markets moving corn to domestic users or export points.
- Export hubs: especially the US Gulf, and in some cases the Pacific Northwest or Atlantic export channels.
- Processing markets: ethanol plants, wet mills, dry mills, starch plants, and livestock feeding regions.
Because transport matters, corn prices often vary by region. Areas with strong local demand from ethanol plants or feed users may bid differently from surplus production zones. Likewise, a location with easy barge or rail access to export markets may show stronger bids than a more isolated area.
How US corn prices are formed
US corn pricing usually starts with the futures market and then adjusts for local conditions through the basis. Basis is the difference between a local cash price and a relevant futures contract. It can be positive or negative depending on demand, logistics, storage, and timing.
In simple terms:
- Futures price reflects the broader national and global market view.
- Basis reflects local supply-demand and movement costs.
- Cash price is roughly futures plus or minus basis, subject to contract terms and quality.
Several factors influence price formation:
- US weather and crop condition during planting, pollination, and harvest
- Yield prospects and harvested acreage
- USDA stock, acreage, and production reports
- Ethanol demand and energy economics
- Livestock feed demand
- Export sales and competition from other major exporters
- Rail, barge, and port logistics
- Storage availability and harvest pressure
- Quality issues such as moisture, test weight, or damage
- Currency movements affecting export competitiveness
| Price type | Where quoted | What it means |
|---|---|---|
| CBOT futures | CME Group market data and trading platforms | Benchmark futures value for standardized corn contracts |
| Local cash bid | Elevators, cooperatives, ethanol plants, feed mills | Actual physical buying price at a local point, usually in US dollars per bushel |
| Delivered price | Buyer contracts or processor bids | Price payable when corn is delivered to a named facility under stated terms |
| FOB export price | Export market discussions and trade reporting | Value at the export terminal before ocean freight |
| CIF import price | Importing-country tenders or trade negotiations | Cost including freight and insurance to the destination market |
Where to check US corn prices online
If you need today’s US corn price, use sources that match the market you want to follow. Since local cash prices differ from futures, it is often necessary to check more than one source.
For futures prices, the benchmark reference is CME Group, which lists CBOT corn futures and options. Broker platforms and market terminals also display live or delayed futures quotes, depending on access.
For national market fundamentals, the US Department of Agriculture is essential. USDA publications such as WASDE, Grain Transportation reports, export sales reporting, and other market updates help explain why prices move. USDA’s Agricultural Marketing Service also publishes cash market information for many grain locations and market categories.
For local cash bids, the most practical sources are:
- Country elevators and grain cooperatives
- Ethanol plant bid sheets
- Feed mills and processors
- Regional grain merchandisers
- Agricultural market information services used by producers and traders
For export-related indications, traders often follow USDA export reports, Gulf market commentary, freight conditions, and merchant market intelligence. Export values are less transparent to retail readers than futures, but the export market still drives inland demand in many areas.
| Source type | Best used for | Practical note |
|---|---|---|
| CME Group | CBOT corn futures benchmark | Useful for national price direction, not for exact farm-gate value |
| USDA Agricultural Marketing Service | Cash market and regional reporting | Good for understanding local cash trends and basis patterns |
| USDA World Agricultural Supply and Demand Estimates | Supply-demand outlook | Important for medium-term market direction |
| Local elevators and processors | Actual physical bid you can sell into | Most relevant for farmers and local grain movement |
Cash market versus futures market
The biggest misunderstanding in grain pricing is treating the futures quote as the price everyone receives. In reality, most physical US corn is bought and sold through the cash market.
Futures market activity takes place on the exchange through brokerage accounts. Users include farmers, elevators, processors, exporters, investment funds, and proprietary traders. Futures are primarily used to manage price risk or take market exposure. Most participants do not intend to load a truck and take physical delivery.
Physical grain is traded through negotiated contracts and posted bids. A farmer typically sells to a local elevator, cooperative, ethanol plant, feed mill, or merchant. The buyer may offer spot bids, forward contracts, basis contracts, hedge-to-arrive contracts, or other commercial arrangements. Physical trade depends on quality specifications, moisture, protein or test weight when relevant, timing, delivery window, and payment terms.
Because of basis risk, a hedge using futures does not fully guarantee a final local cash outcome. Futures may protect against broad market declines, but the local basis can still strengthen or weaken.
How corn is actually bought, sold, exported, and hedged in the US
Physical grain trade
At farm and regional level, corn usually moves by truck to local receivers or by truck and rail to larger terminals. Commercial buyers may include:
- Country elevators and cooperatives
- Ethanol plants
- Livestock feeders and feed mills
- Food and industrial processors
- Large grain merchants and exporters
Contracts may be priced as spot cash sales, forward cash sales, basis-only deals, or other commercial structures. Sellers should pay attention to quality terms, discount schedules, delivery obligations, and counterparty reliability.
Export trade
For export, corn often moves from interior origins by rail or barge to terminal elevators, especially the Gulf. Exporters assemble grain from many origins, hedge price risk in futures, manage freight, and sell to overseas buyers under shipment terms. Inland cash markets can strengthen when export demand is active and transportation flows are efficient.
Futures and options hedging
Futures and options are used by commercial participants and speculators through regulated brokerage accounts. Hedgers use futures to reduce exposure to price swings between purchase and sale dates. Options can provide price insurance-like structures, though they involve premiums and contract selection decisions. These are financial tools, not a substitute for proper physical grain contracting.
Main drivers of US corn prices today and in the near term
US corn prices can change quickly when the market reassesses crop size or demand. The most influential periods are planting, summer weather, harvest, and major USDA reporting dates.
Key drivers include:
- Planting pace and acreage: delays or acreage shifts can alter production expectations.
- Summer weather: heat and rainfall during pollination are especially important.
- Harvest pressure: large nearby supplies can weaken cash bids during harvest if storage is tight.
- Ethanol demand: domestic processing demand matters heavily in the US corn balance sheet.
- Feed demand: livestock margins and herd or flock conditions influence consumption.
- Exports: US competitiveness versus Brazil, Argentina, and other suppliers can move prices.
- River and rail logistics: low water, congestion, or freight disruptions can affect basis.
- US dollar strength: a stronger dollar can reduce export competitiveness.
Forecasting should be framed as scenarios rather than certainty. If US weather is favorable and demand growth is modest, prices may face pressure from larger supplies. If weather reduces yield, logistics tighten, or export demand improves sharply, futures and basis can both strengthen, though not always at the same time or in the same region.
Units, benchmarks, and why conversion matters
In the US domestic market, corn is commonly quoted in US dollars per bushel. This is the normal reference for CBOT futures and most farm cash bids. In international trade, corn may be discussed in US dollars per metric ton. Readers should be careful not to compare a bushel quote with a metric-ton export value without understanding the unit difference and the trade terms behind the price.
The key benchmark for US corn is CBOT corn futures. However, that benchmark does not include local trucking, handling, quality discounts, storage charges, or export elevation costs. Those commercial costs are embedded in local basis or in terminal and export values.
Practical reading of the market
If you want a realistic view of US corn prices today, follow a three-step approach.
- Check CBOT corn futures to understand the national benchmark and daily direction.
- Check local bids from elevators, ethanol plants, or processors in your delivery area.
- Compare basis and delivery terms to see whether your local market is stronger or weaker than the futures move.
This matters because a day with flat futures can still produce a better local cash sale if basis improves. Likewise, a futures rally may not fully reach the farm gate if local bids weaken due to harvest pressure or transport bottlenecks.
FAQ
Where can I check US corn prices today?
Use CME Group for CBOT futures, USDA market reporting for regional cash information, and local elevators, cooperatives, ethanol plants, or processors for actual physical bids in your area.
Is the CBOT corn price the same as the cash price a farmer gets?
No. CBOT futures are the benchmark exchange price. A farmer’s cash price depends on basis, location, quality, delivery period, and local buyer demand.
What currency and unit are US corn prices quoted in?
In the domestic US market, corn is usually quoted in US dollars per bushel. Export discussions may use US dollars per metric ton, especially for FOB or CIF trade.
What does basis mean in the US corn market?
Basis is the difference between the local cash bid and the relevant futures contract. It reflects transport cost, local supply and demand, buyer competition, storage conditions, and logistics.
How is US corn physically sold?
Most physical corn is sold to local elevators, cooperatives, ethanol plants, feed mills, processors, or grain merchants under cash or forward contracts. The exact buyer depends on the region and available logistics.
How do exporters buy US corn?
Exporters usually source corn from inland markets through merchants, elevators, rail terminals, or barge channels, then assemble and ship it through export terminals, often hedging price risk with futures.
Can I trade US corn futures online?
Yes, corn futures and options are traded through licensed brokerage accounts that provide access to CME Group markets. That gives financial exposure to price movement, but it is different from owning or delivering physical grain.
What moves US corn prices the most?
The biggest drivers are US weather, acreage, yields, USDA reports, ethanol demand, feed demand, export competitiveness, logistics, and the relationship between futures and local basis.
Sources
- USDA Agricultural Marketing Service
- USDA World Agricultural Supply and Demand Estimates
- CME Group