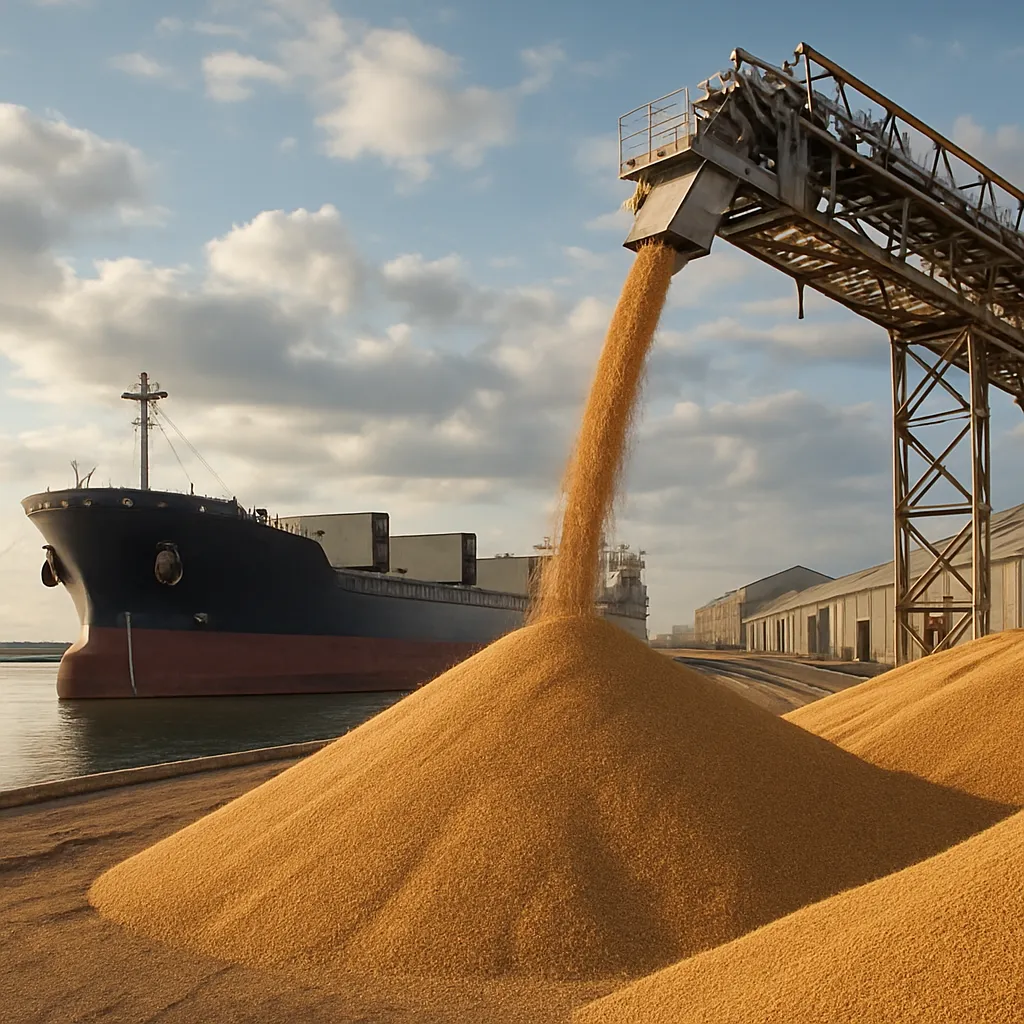
The global grain market serves as a critical nexus between agricultural production and food security. By tracking fluctuations in wheat, maize, and other staple crops, stakeholders from farmers to policymakers gain valuable insights into international trade dynamics. Understanding these price movements hinges on a clear grasp of how global grain price indexes are constructed, the forces that drive their shifts, and the ways they influence trading, risk management, and policy decisions.
Global Grain Markets: Structure and Dynamics
At the heart of the food supply chain lies the grain market, where vast quantities of cereals such as wheat, maize, barley, and rice are exchanged daily. These markets are characterized by a complex interplay of factors:
- Supply conditions, shaped by planting decisions, weather, and technological advances in agriculture.
- Demand drivers, including population growth, dietary shifts, and animal feed requirements.
- International trade policies, tariffs, and export restrictions that can drastically alter price levels.
- Financial commodities markets, where grain contracts are traded as part of a broader portfolio of assets.
In large trading hubs—such as Chicago, Paris, and Singapore—these components converge into a liquid marketplace. Market participants rely on transparent, reliable benchmarks to make informed decisions, manage risk, and ensure efficient allocation of resources.
Anatomy of Global Grain Price Indexes
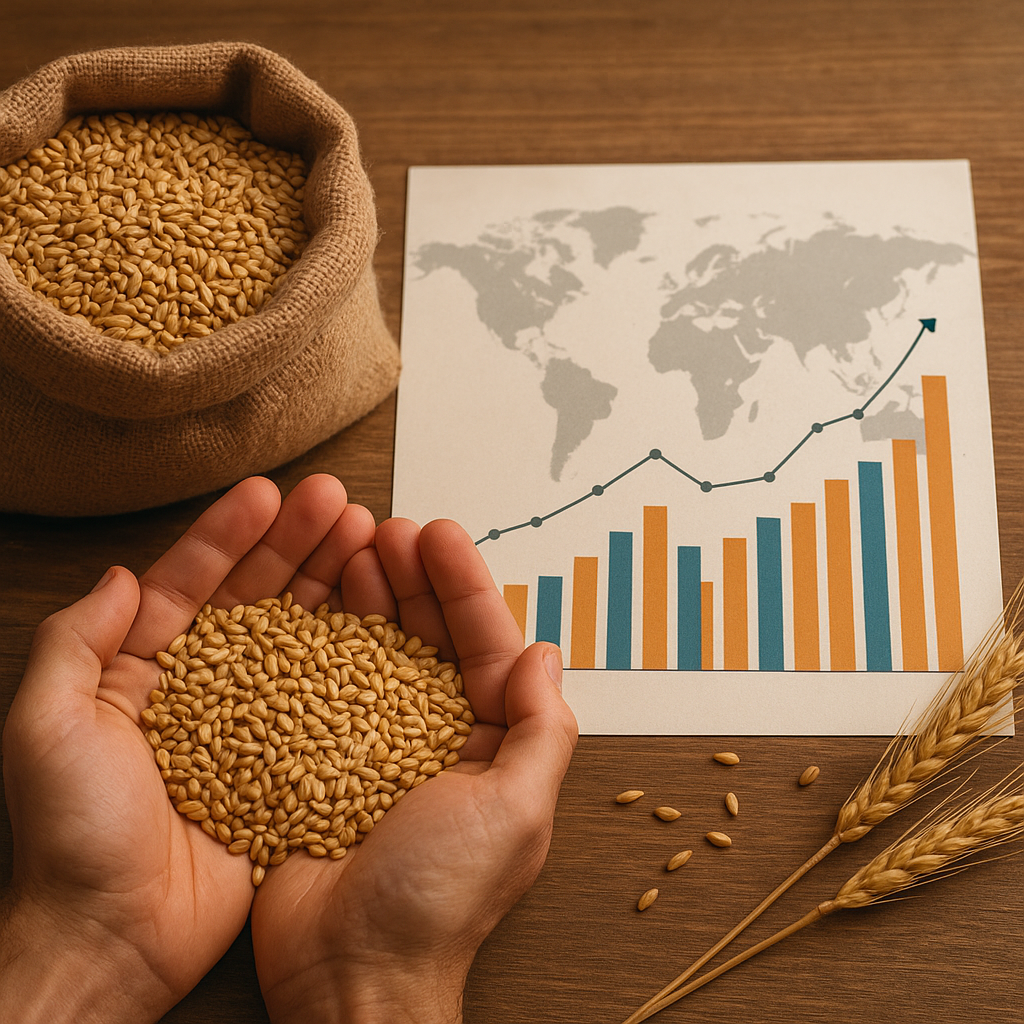
Global grain price indexes condense thousands of discrete transactions into single, interpretable numerical values. Commonly tracked indexes include the FAO Food Price Index, the Bloomberg Agriculture Spot Index, and various regional benchmarks. Despite differences in methodology, most price indexes share certain characteristics:
Basket Composition
Each index typically monitors a “basket” of commodities. For example:
- Staple grains: wheat, maize, barley, rice.
- Oilseeds: soybeans, sunflower, rapeseed.
- Possible inclusion of soft commodities: coffee, sugar, cotton (in broader indices).
The relative weighting assigned to each crop reflects its global production volume, trade share, and economic importance.
Price Aggregation and Weighting
To calculate an index value, the following steps are generally employed:
- Data Collection: Daily or weekly spot prices are gathered from major exchanges and over-the-counter markets.
- Standardization: Prices are converted into a uniform currency (usually USD) and normalized per metric ton.
- Weighting: Each commodity is given a weight based on trade or consumption shares. For instance, wheat might account for 40%, maize 35%, and barley 25% in a grain-only index.
- Aggregation: A weighted average is computed, producing a single price index figure.
These methodologies aim to ensure that the index accurately mirrors market trends rather than idiosyncratic price spikes in a single crop.
Key Drivers of Price Movements
Understanding why grain price indexes rise or fall requires a multifaceted analysis of both fundamental and speculative factors:
Fundamental Supply and Demand Shocks
- Weather Events: Droughts, floods, and heatwaves can decimate harvests, reducing supply and driving prices upward.
- Pest and Disease Outbreaks: Unforeseen infestations—such as locust swarms—can wipe out significant acreage.
- Agricultural Policy Shifts: Subsidies, biofuel mandates, and land-use regulations alter planting incentives.
- Global Consumption Trends: Rising demand in emerging economies for meat leads to greater feed grain usage.
Financial Market Influences
- Futures and Options: Speculators and hedgers trade grain contracts, contributing to short-term volatility.
- Currency Fluctuations: A weaker US dollar often boosts commodity prices, as grains become cheaper for holders of other currencies.
- Interest Rates and Liquidity: Low rates encourage capital flows into commodities, potentially inflating index levels.
Seasonal patterns also play a critical role. Planting and harvesting cycles generate predictable price swings, which are mirrored in the seasonal valuation of grain futures.
Applications of Price Indexes in Risk Management and Trade
Market participants employ grain price indexes to:
- Benchmark Performance: Traders compare portfolio returns against index movements to gauge effectiveness.
- Set Contract Terms: Exporters and importers use index-linked pricing to minimize basis risk over long-term agreements.
- Risk Hedging: Farmers use futures and options tied to indexes to lock in favorable pricing and safeguard revenues.
- Policy Analysis: Governments and NGOs monitor indexes to assess food inflation and develop strategic reserves.
Financial institutions offer structured products—such as swaps and notes—whose payoffs depend directly on index levels. By packaging grain risk, these instruments provide tailored exposure for different risk appetites.
Looking Ahead: Emerging Trends and Technological Innovations
The grain price index landscape continues to evolve under the influence of digitalization and climate change:
- Blockchain and Traceability: Real-time tracking of shipments ensures data integrity, improving price transparency.
- Remote Sensing and AI: Satellite imagery and machine learning models forecast yields, enabling more accurate index projections.
- Climate-Linked Derivatives: New contracts tied to weather indexes allow stakeholders to hedge against specific climate risks.
- Regional Indexes: As local consumption grows, bespoke benchmarks for Africa, Southeast Asia, and Latin America gain prominence.
These innovations promise greater resilience and inclusivity, ensuring that smallholders and developing economies can engage effectively in global trade and benefit from accurate, timely price signals.