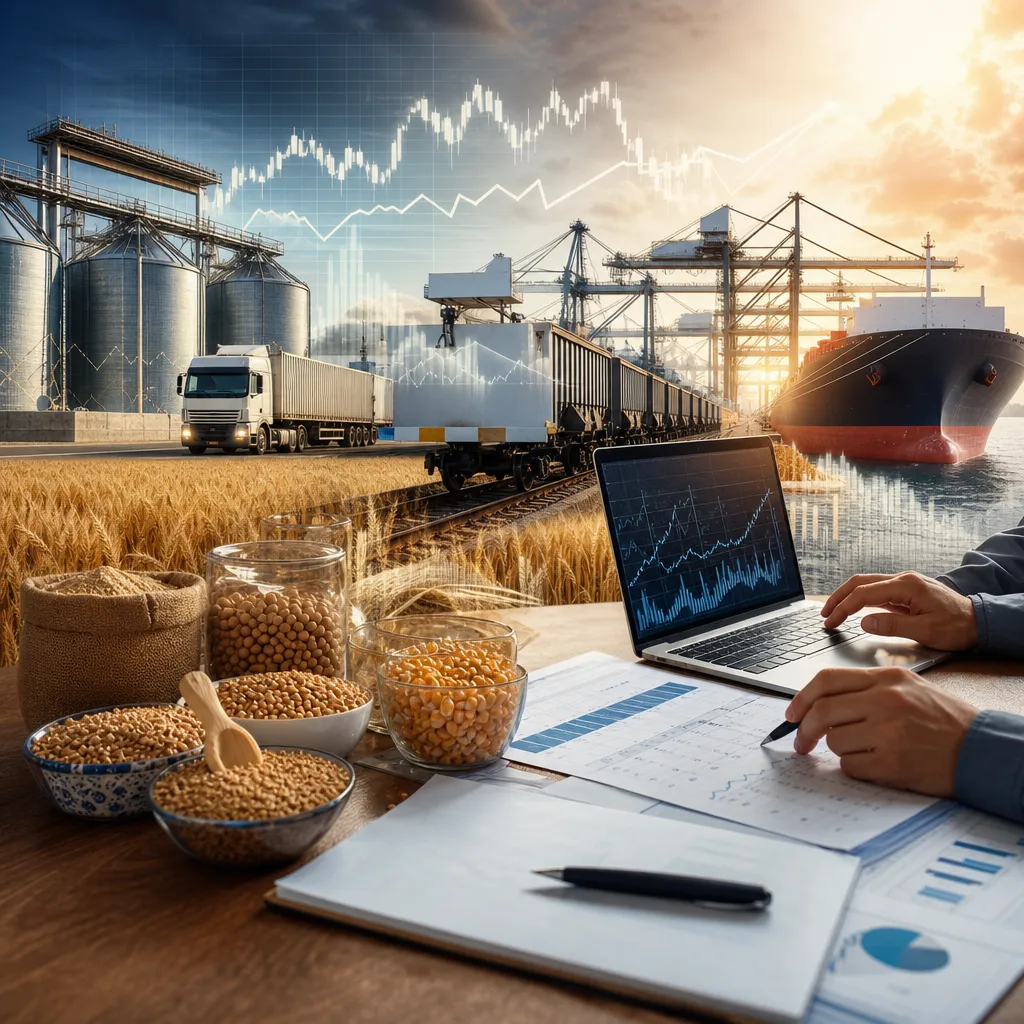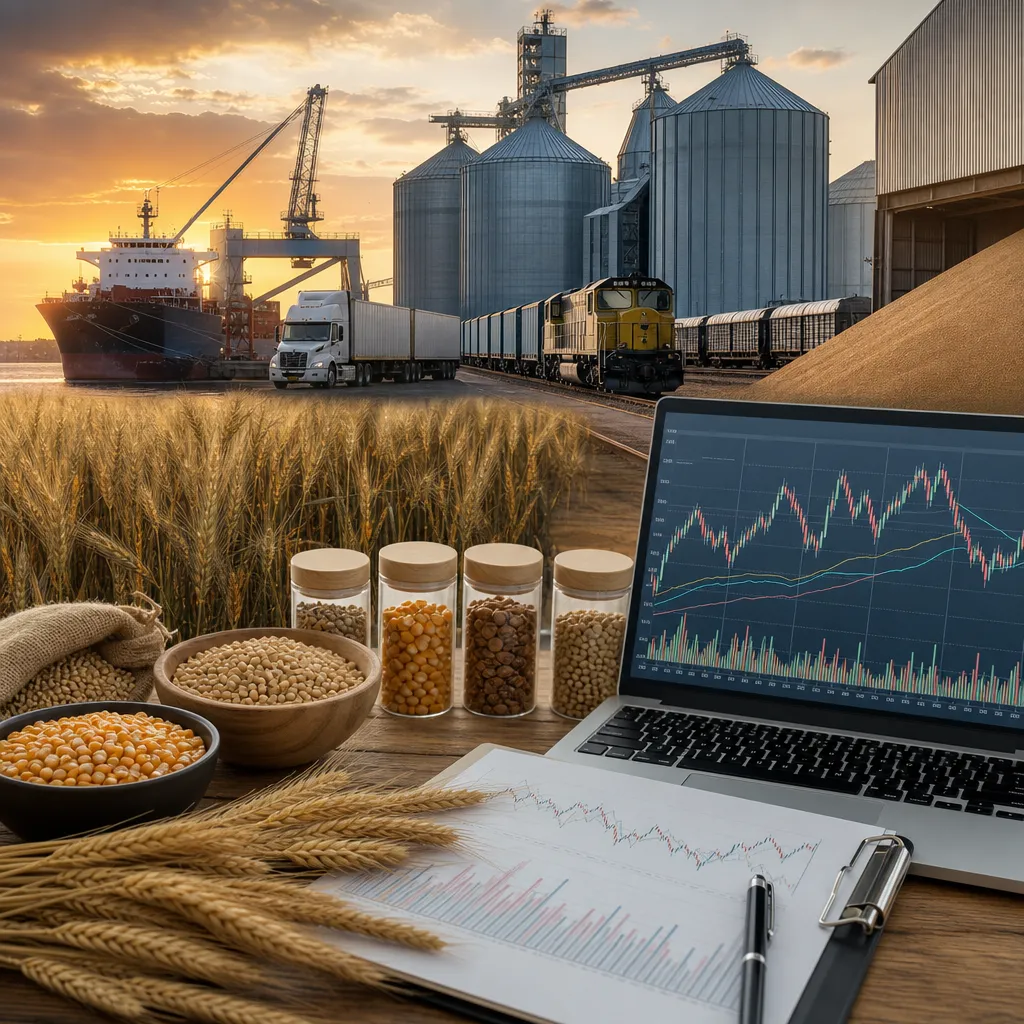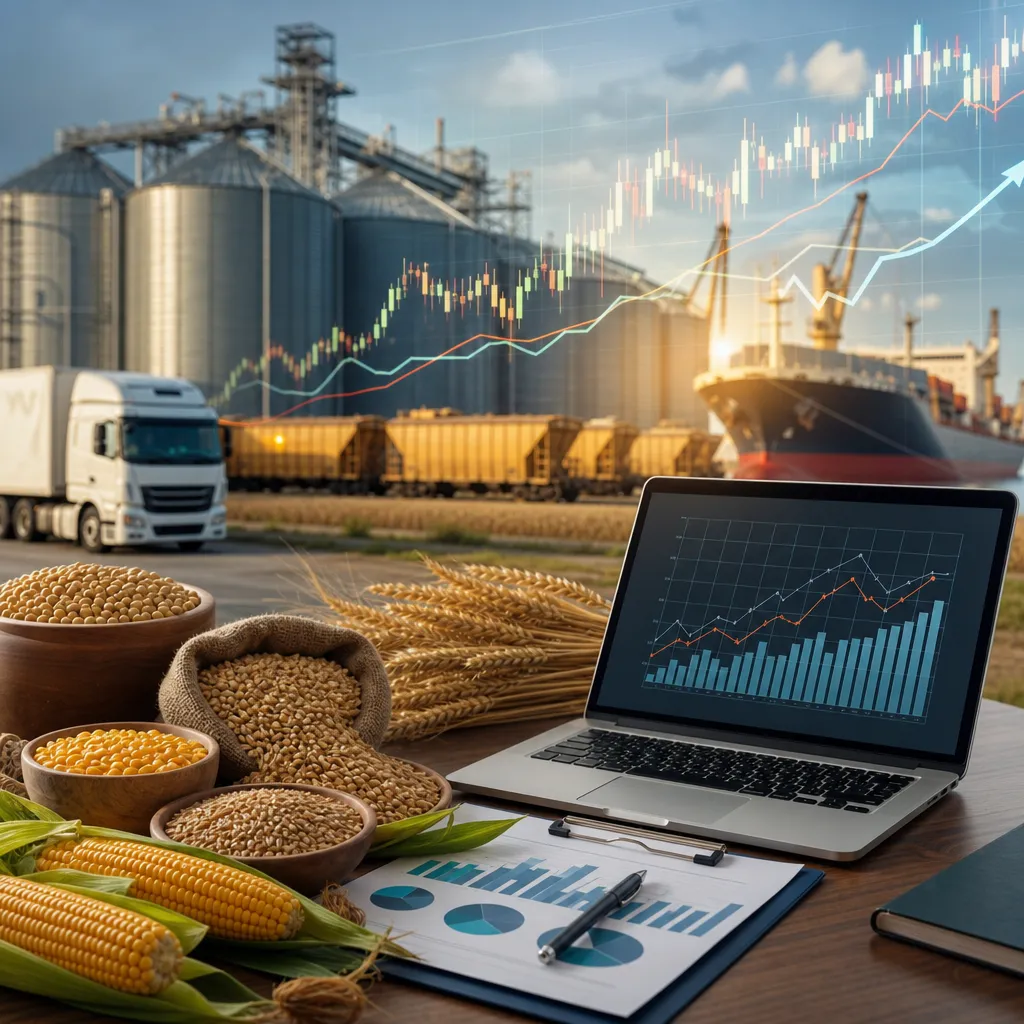
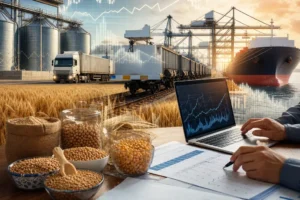
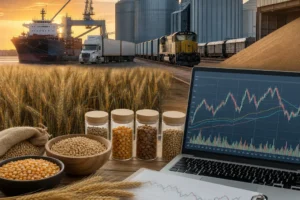
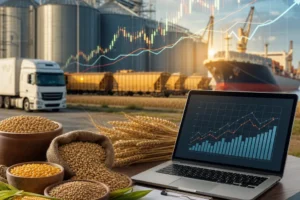
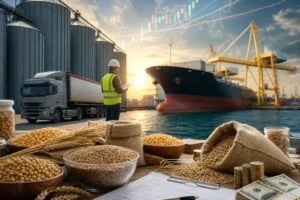
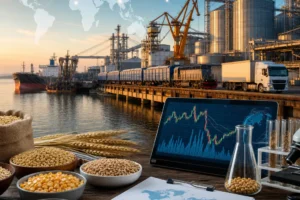

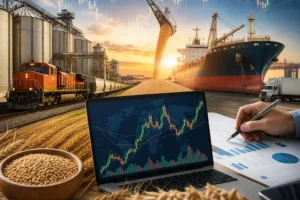
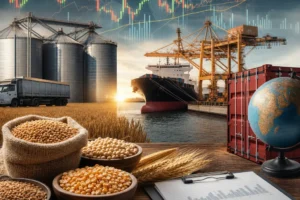
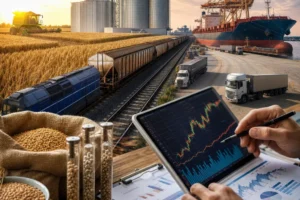
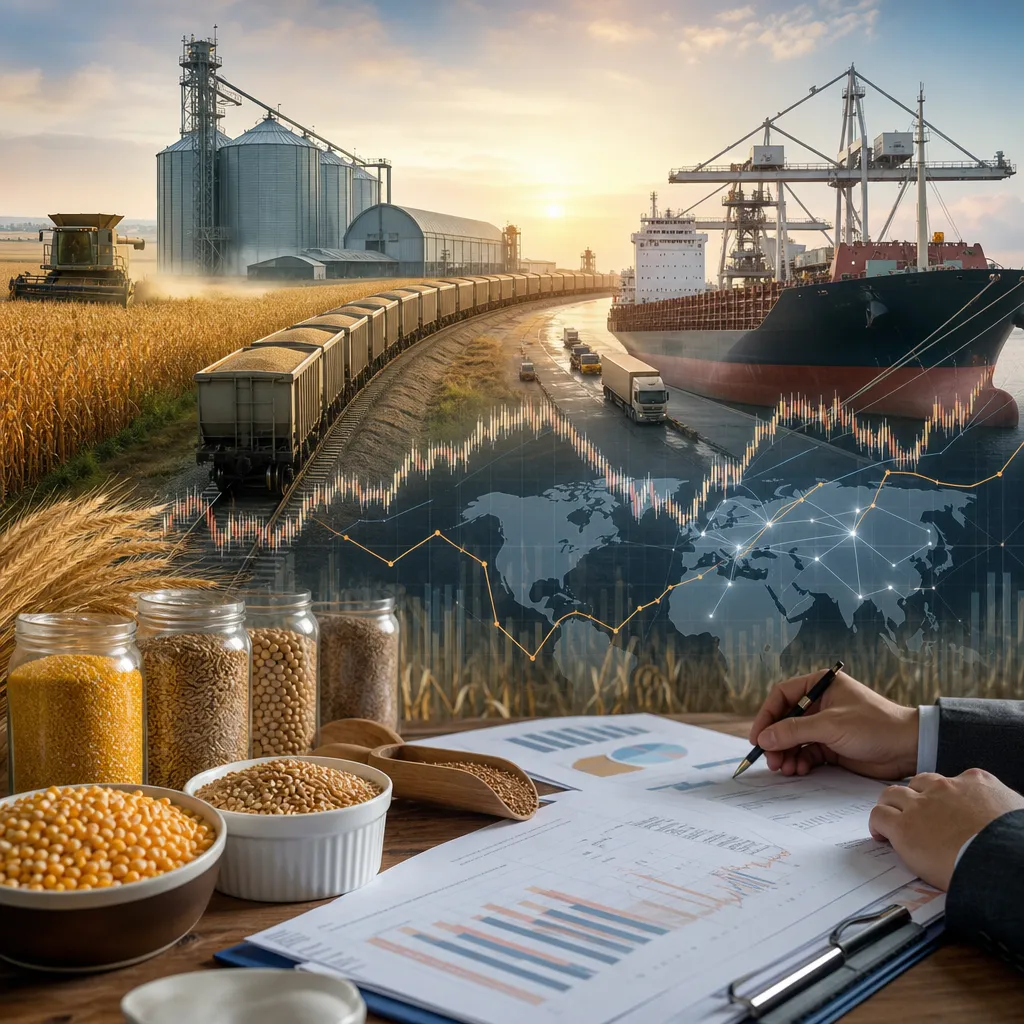
Grain market analysis is the practical process of turning price quotes, crop reports, weather, trade flows, local bids, and logistics information into a usable view of supply, demand, and risk. In practice, it means comparing exchange futures prices with local cash bids, checking whether basis is strong or weak, watching reports such as USDA WASDE and Crop Progress, and understanding how weather, freight, currency, and policy affect actual buying and selling. The most important point is that there is no single “grain price”: futures trade on exchanges, while physical grain is bought and sold through elevators, cooperatives, merchants, processors, exporters, and feed users at location-specific cash prices. Good analysis connects the online market data to the real-world grain movement system.
Whether the reader is a farmer, grain merchandiser, importer, processor, trader, or analyst, the workflow is similar: identify the benchmark market, check the local cash market, review the main fundamental reports, track logistics and quality, and then decide whether to hold, sell, hedge, buy, or wait. That is what makes grain market analysis practical rather than theoretical.
What grain market analysis actually covers
Grain market analysis usually combines four layers of information.
- Exchange market: futures and options for wheat, corn, soybeans, soy products, canola in some regions, and other related contracts where available.
- Physical cash market: local elevator bids, export prices, processor bids, feed mill demand, and negotiated merchant contracts.
- Fundamentals: acreage, yield, harvested area, stocks, exports, imports, crush or milling demand, feed demand, and government policy.
- Execution factors: freight, storage, drying, quality, delivery timing, currency moves, margins, and basis risk.
For example, a corn analysis may start with a CME futures contract as a benchmark, but the commercial decision is often based on the local cash bid at a delivery point such as a country elevator, ethanol plant, feed mill, river terminal, or export house. The difference between the futures benchmark and the local cash price is the basis. Basis reflects local supply and demand, transport costs, storage pressure, and buyer urgency.
Where grain prices are quoted and how to use them
Grain prices exist in more than one form, and using the wrong one is a common mistake.
| Price type | Where it is found | What it represents | Main limitation |
|---|---|---|---|
| Futures price | Commodity exchange data, broker platforms, CME Group and other exchange-related data services | Standardized contract price for a delivery month | Not the same as the local price paid for physical grain |
| Local cash bid | Elevators, cooperatives, processors, merchants, feed mills, local market reporting systems | Actual buy price at a named location and quality specification | Varies by location, freight, quality, and timing |
| Export or FOB price | Trade reporting services, merchant indications, official reporting in some markets | Price at port or export point under specific trade terms | May not reflect inland farm value after freight and handling |
| Indicative flat price | Broker screens, merchant sheets, market commentary | Reference price combining futures and basis or merchant estimate | May not be a firm executable bid |
For exchange prices, traders typically use regulated futures exchanges and their data feeds. For U.S. benchmark grains, CME Group is a major reference point for corn, wheat, soybeans, soybean meal, and soybean oil. In Europe or other regions, readers may use local exchange benchmarks where relevant. These prices are usually displayed by brokerage platforms, exchange websites, financial terminals, and agricultural market data services.
For local physical prices, farmers and commercial buyers more often check elevator bid sheets, cooperative bid pages, processor bids, merchant offer sheets, local cash market apps, or official market reporting agencies. These are the prices that matter for a physical sale. A local wheat bid can differ substantially from a futures chart because of protein premium or discount, moisture, location, truck freight, or current storage congestion.
How the physical grain market works
Physical grain trading is a supply-chain business, not just a screen price. Grain changes hands through a network of collection, storage, transport, processing, and export points.
A typical transaction may involve a farmer delivering grain to a country elevator or cooperative. The elevator either stores it, sells it to a processor, moves it to a terminal, or ships it to an exporter. In other cases, grain merchants and brokers arrange direct trades between a producer and a feed mill, flour mill, crusher, ethanol plant, maltster, or livestock business.
The important commercial terms usually include:
- Delivery point: farm pickup, local elevator, warehouse, terminal, mill, plant, or port.
- Quality: grade, test weight, moisture, foreign material, falling number, protein, oil, damage, mycotoxins, or other crop-specific traits.
- Basis or premium/discount: adjustment versus a benchmark futures or export reference.
- Freight: who pays truck, rail, barge, or vessel costs.
- Timing: spot delivery, harvest delivery, deferred shipment, or storage agreement.
- Payment terms: when title transfers and when payment is due.
- Inspection and claims: how quality disputes are handled.
In export trade, transactions may be structured under common trade terms such as FOB or CIF, depending on the route and buyer. These are usually handled by grain merchants, exporters, importers, and shipping counterparties rather than retail-style online buying platforms. Online marketplaces may help discovery in some regions, but the actual transaction still depends on specification, logistics, documents, and counterparty approval.
How futures and options fit into grain analysis
Futures and options are mainly risk-management and price-discovery tools. They are not the same as physically buying a truckload of grain, and most users never make or take delivery through the exchange.
| Market type | How it works | Who uses it | Main risk |
|---|---|---|---|
| Futures | Standardized contract traded on a regulated exchange through a broker account | Farmers, merchandisers, processors, exporters, hedge funds, speculators | Margin calls and leverage losses |
| Options | Right, but not obligation, to buy or sell a futures contract at a strike price | Hedgers seeking flexibility, traders managing defined-risk structures | Premium cost and time decay |
| Cash contract | Physical grain sale or purchase with a merchant, elevator, cooperative, or processor | Farmers and commercial grain users | Basis, quality, delivery, and counterparty risk |
| OTC forward contract | Privately negotiated agreement for future physical delivery or pricing | Merchants, processors, producers, importers | Less standardization and greater counterparty exposure |
To trade grain futures or options, a user normally needs an account with a regulated futures broker or introducing broker that provides exchange access. The broker platform shows quotes, order entry, account balances, and margin status. This is financial trading. It does not automatically arrange trucks, warehouse receipts, phytosanitary documents, or port loading.
Commercial hedgers use futures to offset price risk in the physical market. For example, a farmer expecting to sell physical corn later may hedge with futures if the goal is to reduce downside price risk. A feed manufacturer may buy futures to help protect against rising input prices. Options may be used when the hedger wants price protection with more flexibility, though the premium cost matters.
The limitation is basis risk. If futures fall but local basis strengthens, or vice versa, the hedge outcome may differ from the initial expectation. That is why grain analysis always needs both futures and local cash data.
Key reports and data sources used in grain analysis
Reliable grain analysis depends on official and exchange-based data before opinion-based commentary. The most widely used public reports come from agricultural departments, exchanges, and trade regulators.
Important sources include USDA reports such as:
- WASDE: broad balance sheet updates for major crops, including supply, use, trade, and ending stocks.
- Crop Progress: weekly conditions, planting, emergence, heading, maturity, and harvest pace where relevant.
- Grain Stocks: stock levels that can shift supply expectations.
- Prospective Plantings and Acreage: indications of planting intentions and actual area.
- Export Sales: weekly export commitments, useful for demand tracking.
For positioning and sentiment, the U.S. Commodity Futures Trading Commission publishes Commitments of Traders, which shows how different trader categories are positioned in regulated futures markets. Analysts use it to understand whether funds are heavily long or short, but it is not a timing tool by itself.
Exchange data from CME Group and other exchanges provides contract specifications, delivery months, settlement information, and price history. This is essential when comparing old-crop and new-crop contracts or analyzing spreads.
For international context, FAO and national statistical agencies help track broader production, food balance, and trade developments. Customs and official trade databases can help verify import and export flows, although those figures often appear with a time lag.
How to analyze grain markets step by step
A practical grain market analysis process usually follows a repeatable structure.
- Identify the crop and region. Wheat in a Black Sea export market behaves differently from U.S. Midwest corn or Asian rice.
- Choose the benchmark price. This may be a futures contract, export reference, or local cash index.
- Check the nearby and forward market. Compare spot demand with future delivery months.
- Review basis. Strong basis often signals nearby physical demand or logistics tightness; weak basis can point to burdensome local supply.
- Read the latest official reports. Focus on stocks, production changes, export revisions, and crop condition trends.
- Assess weather. Heat, drought, excessive rain, frost, and harvest delays affect yield, quality, and timing.
- Track logistics. River levels, port lineups, rail service, truck availability, and vessel flow can change local price relationships.
- Consider macro drivers. Currency moves, energy prices, fertilizer costs, and policy decisions affect competitiveness and farm margins.
- Separate scenario from conviction. Build bullish, neutral, and bearish cases instead of assuming certainty.
This process can be done with a mix of public sources and commercial tools. Smaller farms may rely on elevator bids, cooperative communications, USDA reports, and weather services. Merchandisers and trading firms often combine those with paid market terminals, shipping intelligence, proprietary balance sheets, and risk software.
Storage, quality, and logistics in market analysis
Storage economics can be as important as direction on a price chart. A farmer or merchant deciding whether to store grain must compare the potential improvement in basis or futures carry against the real costs and risks of storage.
Typical storage costs include commercial storage charges, on-farm bin costs, interest on unsold inventory, drying, aeration energy, shrink, handling, and quality loss risk. Grain that deteriorates in storage may lose grade and marketability, especially where buyers are strict about moisture, damage, vomitoxin, protein, or milling quality.
Logistics also matter. A region can have a large crop and still show strong nearby basis if transport is disrupted and buyers need prompt supply. The reverse also happens: good transport access and heavy farmer selling can pressure basis even when international futures are firm.
For physical execution, grain may be stored on farm, at a cooperative, in a licensed warehouse, at a terminal, or under a merchant-controlled arrangement. Each option changes control, flexibility, and cost. Analysis should include whether the grain can be moved when needed and whether quality claims are independently verifiable.
Tools, websites, and software used for grain market analysis
The right tool depends on whether the user is trading financially, merchandising physical grain, or managing a farm business.
- Exchange websites and broker platforms: used for futures quotes, contract details, options chains, and trade execution.
- Government portals: used for official crop reports, export data, production estimates, and statistics.
- Elevator and cooperative bid systems: used to monitor local cash bids and delivery opportunities.
- Farm management software: used to track inventory, contracts, breakevens, and sales decisions.
- Commercial market-data services: used by traders and analysts for charting, news, export lineups, weather analytics, and cash market intelligence.
- Weather platforms and satellite tools: used to monitor crop stress, rainfall patterns, and harvest disruption.
- Accounting and risk tools: used to connect market decisions to margin, financing, and hedging exposure.
Some users also connect data through APIs, especially trading firms, analytics teams, and software developers. Exchange data, weather data, and government datasets may be available in machine-readable form depending on the publisher. The key is to verify entitlement, update frequency, units, and licensing before building automated models around the data.
Common mistakes in grain market analysis
- Confusing futures with farmgate price. A futures quote is only a benchmark until basis and local terms are applied.
- Ignoring quality. Protein, moisture, damage, and contamination can change value dramatically.
- Using national data without local context. A strong national balance sheet may hide regional shortages or transport bottlenecks.
- Focusing only on direction. Timing, carry structure, basis movement, and storage economics often matter just as much.
- Underestimating leverage. Futures and options require risk controls, margin discipline, and position sizing.
- Relying on one report. Good analysis combines acreage, crop progress, exports, stocks, and weather rather than overreacting to a single headline.
Where can I check grain prices today?
For futures, use exchange-related data from CME Group or a regulated broker platform. For actual physical selling prices, check local elevator bids, cooperative bid sheets, processor bids, or official regional cash market reporting where available. The local cash bid is usually the most relevant number for a physical sale.
What is the difference between futures price and cash price?
Futures is a standardized exchange-traded benchmark for a delivery month. Cash price is the actual physical price at a specific location and quality. The difference between them is basis, which changes with freight, local supply and demand, storage pressure, and buyer needs.
Where does physical grain buying and selling normally happen?
Most physical transactions happen through grain elevators, cooperatives, merchants, processors, feed mills, exporters, and mills rather than through retail trading apps. Deals may be spot, forward, or contract-based and usually depend on delivery point, quality, freight, and payment terms.
Do I need a broker to trade grain futures?
Yes, futures and options are normally accessed through a regulated futures broker or a firm providing exchange access. That is different from selling physical grain to an elevator or merchant. A brokerage account is for financial trading, not for arranging ordinary farm deliveries.
Which reports matter most for grain market analysis?
USDA WASDE, Crop Progress, Export Sales, Grain Stocks, and acreage reports are widely used for major crops. CFTC Commitments of Traders helps analysts track speculative and commercial positioning in futures markets. Exchange contract data is also important for spreads, expiries, and delivery rules.
How do weather and logistics affect grain prices?
Weather changes yield, quality, and harvest timing. Logistics affect whether grain can move to the buyer efficiently. Drought can cut production, while excessive rain can damage quality; low river levels, rail disruption, or port congestion can change basis and export competitiveness even if futures are stable.
Is storing grain always profitable if prices might rise later?
No. Storage only makes sense if the likely price improvement or basis gain exceeds storage cost, interest, shrink, handling, and quality risk. A good analysis compares those costs with the market carry and the local basis outlook rather than assuming time alone adds value.
Can grain market analysis be automated with software or APIs?
Partly, yes. Market data, government reports, and weather information can often be organized in software or through APIs where available. But physical grain analysis still needs human judgment about quality, counterparty behavior, freight, and local market conditions that may not be fully visible in screen data.
Sources
- USDA Foreign Agricultural Service and USDA World Agricultural Supply and Demand Estimates
- CME Group
- U.S. Commodity Futures Trading Commission