
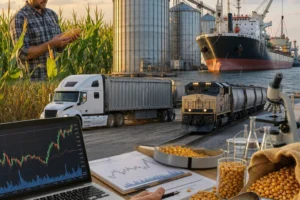
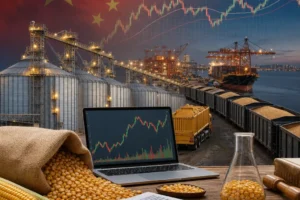
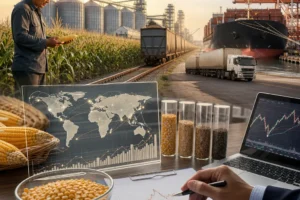
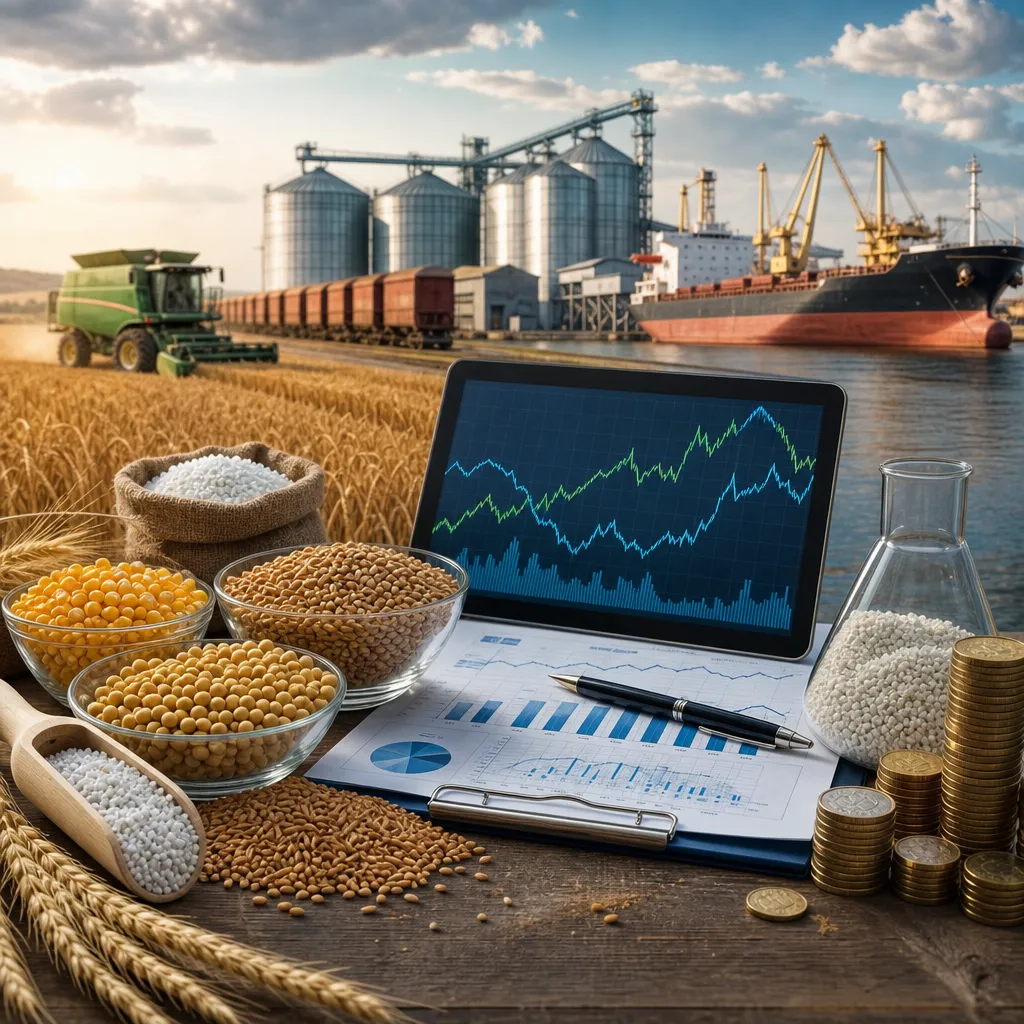
Grain prices and fertilizer costs are tightly linked because fertilizer is one of the largest variable costs in grain production and a major driver of break-even levels. When fertilizer prices rise, farmers often need higher grain prices to protect margins, and they may also change acreage, crop mix, and application rates, which can later affect supply. The relationship is not one-to-one: grain prices influence fertilizer demand, while fertilizer prices influence planting decisions and yield potential. To use this relationship in practice, farmers, grain buyers, and traders need to watch both exchange-based grain benchmarks and local physical input and grain markets.
In most real decisions, the key question is not simply whether grain or fertilizer is “expensive,” but whether the expected grain revenue covers fertilizer, fuel, rent, logistics, and financing at a workable margin. That means comparing local cash grain bids with local delivered fertilizer offers, not relying only on headline futures quotes. Futures markets help with price discovery and hedging, but physical fertilizer and physical grain are bought and sold through merchants, cooperatives, retailers, elevators, processors, and import channels. Understanding where each price comes from is essential.
Why fertilizer costs matter to grain prices
Fertilizer affects grain markets through farm economics. Nitrogen, phosphate, and potash are core inputs for crops such as corn, wheat, rice, canola, and, to a lesser extent, soybeans depending on soil conditions and rotation. If fertilizer costs increase sharply, growers may reduce application rates, switch acreage from fertilizer-intensive crops to less intensive ones, or delay purchases. Those decisions can alter planted area, expected yields, and eventually grain supply.
Corn is often the clearest example because it is relatively nitrogen-intensive. When nitrogen prices rise faster than corn prices, corn margins can deteriorate quickly. Some acreage may move to soybeans or other crops with lower fertilizer requirements. In contrast, if corn futures strengthen while fertilizer prices remain stable, growers may be willing to maintain or expand corn acres.
The relationship also works in reverse. High grain prices tend to support fertilizer demand because farmers expect stronger revenues and may invest more aggressively in yield. That can tighten fertilizer supply chains, especially when imports, natural gas costs, plant shutdowns, shipping, or sanctions affect global nutrient availability.
Where grain prices are quoted, and why that is not the same as your local price
Grain prices exist in different layers of the market. The most visible are futures prices on regulated exchanges. For major internationally referenced crops, market participants often watch contracts on CME Group, including corn, soybeans, soybean meal, soybean oil, and Chicago wheat. Other exchanges may be relevant for regional trade and rapeseed or milling wheat benchmarks.
These futures prices are benchmark prices for standardized contracts. They are not automatically the price a farmer receives at a local elevator or the exact price a feed mill pays for physical grain. The physical price is usually the cash price, often expressed as futures plus or minus basis. Basis reflects location, freight, storage, local supply and demand, quality, handling capacity, and buyer competition.
In practice, farmers and local buyers usually check cash bids through:
- grain elevators and cooperatives,
- merchant bid sheets,
- processor procurement offices,
- export terminals or port buyers where relevant,
- official market reporting services, where available,
- farm marketing software or regional market apps that aggregate local bids.
For a practical comparison, a farmer might look at:
- a CME corn futures contract for the benchmark market level,
- the local elevator bid for nearby delivery,
- the local fertilizer retailer’s offer for nitrogen, phosphate, and potash,
- trucking or on-farm delivery cost,
- expected yield and storage decision.
Only after combining those elements can the farmer estimate margin per acre or decide whether to forward sell grain, buy fertilizer now, or wait.
| Market item | Where it is found | What it represents | Main limitation |
|---|---|---|---|
| Grain futures price | Regulated exchange data such as CME Group | Standardized benchmark contract | Not the same as local farmgate cash price |
| Local cash grain bid | Elevator, cooperative, processor, merchant | Actual physical purchase offer at a location | Varies by quality, freight, timing, and basis |
| Retail fertilizer price | Input retailer, cooperative, distributor | Physical nutrient offer for delivery or pickup | Can change with energy, imports, and logistics |
| Imported fertilizer benchmark | Trade data, market reporting agencies, import channels | Wholesale or port-level reference | May exclude inland freight and retail markup |
How fertilizer costs feed into planting decisions and grain supply
Fertilizer costs matter most before and during planting, when growers build crop budgets. A typical budgeting process compares expected revenue per acre against variable costs. Fertilizer is usually analyzed crop by crop because nutrient demand differs across corn, wheat, rapeseed, rice, barley, and soybeans.
If nitrogen prices rise sharply, farmers may respond in several ways:
- shift acreage from corn to soybeans or other less fertilizer-intensive crops,
- reduce top-dress or total application rates,
- favor land or fields with better residual fertility,
- delay purchases in hopes of lower input prices,
- lock in grain prices earlier if margins are still profitable.
Each response can affect the later grain market. More soybean acres can pressure soybean prices if yields are good, while fewer corn acres can tighten corn balance sheets. Lower nutrient use may or may not reduce yields depending on soil reserves, weather, timing, and agronomic management, but the risk rises when cuts are aggressive.
This is why grain analysts watch fertilizer alongside acreage surveys, weather models, and crop condition reports. Fertilizer costs do not set grain prices by themselves, but they strongly influence producer behavior.
Where and how fertilizer is bought in the physical market
Unlike exchange-traded grain futures, fertilizer is mainly a physical procurement market. Farmers normally buy through local agricultural retailers, cooperatives, distributors, or agro-input divisions of larger merchants. In some regions, large farms may buy directly from wholesalers, importers, or manufacturing-linked distributors, but even then inland transport, storage, and application logistics matter.
The transaction usually includes more than the nutrient headline price. Buyers should check:
- product type and guaranteed analysis,
- unit of sale,
- pickup point or delivered price,
- timing of delivery,
- application service if bundled,
- payment terms and finance cost,
- availability and substitution options.
Physical fertilizer pricing can differ significantly between port, wholesale terminal, and farm-delivered levels. A low international benchmark is not useful if local inland freight, storage bottlenecks, import restrictions, or retail scarcity keep farm offers high. For that reason, large grain producers often compare several local suppliers rather than relying only on general market commentary.
How farmers and traders use grain markets to manage fertilizer risk
There is no simple universal hedge that perfectly offsets retail fertilizer cost. Some participants use a combination of grain hedging, input forward buying, and margin budgeting rather than trying to trade fertilizer exposure directly. For many farms, the practical risk-management decision is to secure a profitable gross margin rather than predict either market perfectly.
A common approach is:
- estimate production cost per acre, including fertilizer,
- obtain local grain bids or hedge using futures,
- compare expected revenue against cost,
- lock in some grain sales and some input purchases when margin is acceptable,
- leave part of production open in case conditions improve.
Grain hedging normally takes place through a regulated futures exchange using a licensed futures broker. That requires a brokerage account and involves margin, daily mark-to-market, contract size considerations, and the risk that futures move against the hedge before cash grain is sold. This is financial trading, not the same as delivering physical grain to an elevator.
Physical grain selling, by contrast, usually happens through forward contracts, cash sales, basis contracts, or storage-and-later-sale decisions with an elevator, cooperative, processor, feed mill, or merchant. A hedge can reduce outright price risk, but it does not eliminate basis risk or crop production risk.
| Tool | Where it is used | Main purpose | Key risk or limitation |
|---|---|---|---|
| Futures hedge | Regulated exchange via futures broker | Manage benchmark grain price risk | Margin calls and basis risk |
| Options on futures | Regulated exchange via broker | Protect downside while keeping some upside | Premium cost and strategy complexity |
| Forward grain contract | Elevator, cooperative, processor, merchant | Lock physical sale terms | Production shortfall or contract performance risk |
| Forward fertilizer purchase | Retailer, distributor, cooperative | Secure input cost and availability | Price may fall later or product may be overbought |
Which reports and data sources are most useful
The best analysis combines official grain data with local input intelligence. For grain, USDA reports are widely used even outside the United States because they shape global price expectations. The most important include:
- WASDE for supply, demand, trade, and ending stocks,
- Crop Progress for planting, emergence, and condition updates,
- Acreage and Grain Stocks for U.S. supply signals,
- Export Sales for demand trends,
- NASS surveys for production and state-level information.
For futures positioning and sentiment, many analysts use CFTC Commitments of Traders data to see how major participant categories are positioned in grain futures and options. For benchmark exchange contract details, settlement information, delivery rules, and contract specifications, CME Group is the key source for major U.S. grain contracts.
For broader global food and trade context, FAO and national agricultural ministries or statistical agencies can help, especially in import-dependent or export-oriented regions. For fertilizer, market participants also watch energy prices, import flows, domestic distributor inventories, and retailer offers because local fertilizer pricing is often less transparent than exchange-traded grain pricing.
How to analyze grain prices versus fertilizer costs in practice
A useful method is to track the expected gross margin by crop instead of watching any single market in isolation. This can be done with a spreadsheet, farm management software, or a grain marketing program that allows cost and sales planning. The minimum practical inputs are local cash grain bids, expected yield, fertilizer program, and non-fertilizer variable costs.
Steps usually include:
- Collect local bids for the crop and delivery month you expect to sell.
- Collect fertilizer quotes from one or more suppliers, including delivery or application if relevant.
- Convert all figures into the same per-acre or per-ton economic view.
- Estimate break-even and target margin.
- Run scenarios for lower yield, weaker basis, or higher fertilizer replacement cost.
- Decide whether to pre-buy inputs, pre-sell grain, store grain, or leave flexibility.
Analysts and commercial traders may also compare fertilizer-sensitive acreage signals, weather risk, and export competitiveness. For example, a market may support grain prices if high fertilizer cost reduces planting intentions, but that support can disappear if weather delivers exceptional yields or if another exporting region expands production.
Key risks, costs, and limitations
The biggest mistake is treating one quoted market as the entire answer. A strong futures market does not guarantee strong farm margins if basis is weak, freight is high, or fertilizer costs have jumped. Likewise, cheaper fertilizer does not automatically improve profitability if grain demand softens or yields disappoint.
Main risks to monitor include:
- Basis risk: local cash prices can diverge from futures.
- Timing risk: fertilizer may be cheapest at a different time than grain is most attractive to sell.
- Weather risk: lower applications may work in one season and fail badly in another.
- Logistics risk: port congestion, rail disruptions, barge limits, or truck shortages can affect both inputs and grain movement.
- Counterparty risk: this matters in forward contracts with merchants, buyers, or suppliers.
- Leverage risk: futures and options accounts can create cash-flow strain even when the hedge makes economic sense overall.
Storage also matters. On-farm storage can improve sales flexibility and basis timing, but it adds handling, quality, shrink, finance, and aeration considerations. Commercial storage through elevators or warehouses can help logistically, but fees and timing need to be checked carefully.
Where can I check grain prices and local bids?
Benchmark futures prices are commonly checked through exchange data such as CME Group or through broker and market-data platforms. Local cash bids are usually checked directly with grain elevators, cooperatives, processors, merchants, or official regional market reporting services where available. The local bid is the more relevant number for physical grain sales.
Where are fertilizer prices normally found?
Farm-level fertilizer prices are usually obtained from agricultural retailers, cooperatives, distributors, and input suppliers. Wholesale or trade commentary may indicate broader direction, but the actionable price is the delivered, picked-up, or applied offer in your local market.
Do higher fertilizer prices always mean higher grain prices?
No. Higher fertilizer costs can support grain prices by reducing acreage or yield potential, but grain prices still depend on total supply, weather, stocks, exports, feed demand, biofuels, currency moves, and government policy. The effect is indirect and can be offset by other forces.
Can I trade fertilizer like grain futures?
In most farm-level practice, fertilizer risk is managed more through physical purchasing strategy and grain hedging than through a straightforward retail fertilizer trading mechanism. Grain futures and options trade on regulated exchanges through brokers, while physical fertilizer is normally bought through suppliers and distributors.
What is the difference between a futures grain price and a cash grain price?
A futures price is an exchange-traded benchmark for a standardized contract month, quality, and delivery structure. A cash price is the actual local price for physical grain at a specific elevator, processor, or delivery point. The difference between them is basis, which reflects local market conditions.
How do farmers use grain prices to protect against fertilizer cost swings?
Many farmers calculate an expected margin and then lock in part of that margin by forward buying fertilizer, forward contracting grain, or hedging futures. The goal is often to secure an acceptable production margin rather than maximize the absolute best price in either market.
Which reports are most useful for following this relationship?
USDA WASDE, Crop Progress, Acreage, Grain Stocks, and Export Sales are among the most useful for grain fundamentals. CFTC Commitments of Traders helps interpret futures positioning. For fertilizer, local supplier quotes, import conditions, and energy market developments are often more actionable than broad headline commentary.
Sources
- USDA World Agricultural Supply and Demand Estimates
- CME Group agricultural futures and options contract information
- U.S. Commodity Futures Trading Commission Commitments of Traders