

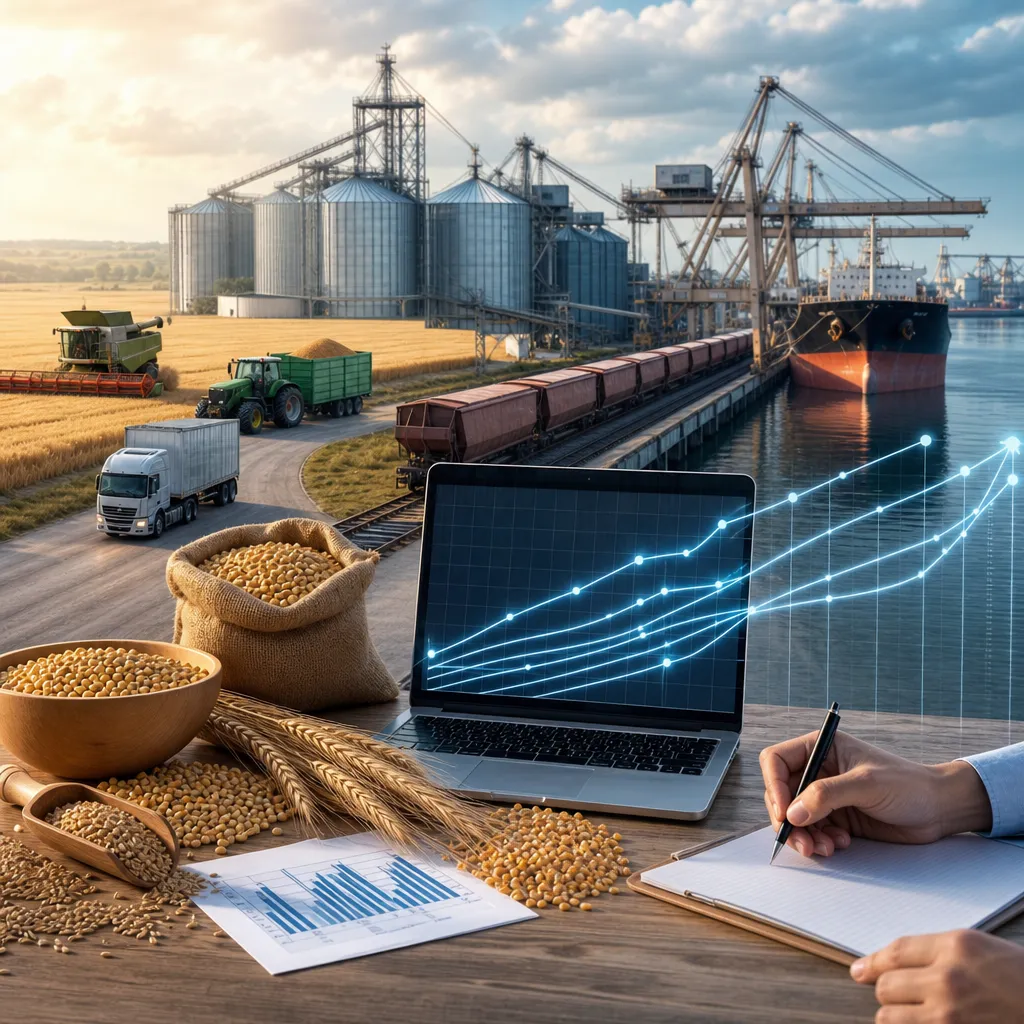
A grain futures curve shows the prices of grain futures contracts for different delivery months at the same time. It is one of the quickest ways to see how the market values storage, nearby supply tightness, harvest pressure, and future uncertainty for crops such as corn, wheat, soybeans, oats, rough rice, canola, or rapeseed. In practice, farmers, merchandisers, processors, exporters, hedge funds, and analysts use the curve to compare nearby and deferred prices, make hedging decisions, judge carry in the market, and relate exchange values to local cash bids. The curve is useful, but it is not the same as the physical grain price in your local market, because local basis, freight, quality, storage, and delivery conditions still matter.
What a grain futures curve is
The futures curve is the lineup of futures prices across contract months for one commodity on one exchange. For example, corn on CME Group may have listed contracts for March, May, July, September, and December. If you place those prices side by side, you get a curve.
That curve answers practical questions:
- Is the market paying more for grain later than now?
- Is there enough price carry to justify storage?
- Is the nearby market tight relative to deferred months?
- How is the trade pricing harvest versus old-crop grain?
- Which month should a hedge be placed in?
In grain markets, the shape often reflects seasonality. New-crop contracts can trade quite differently from old-crop contracts because weather, acreage, stocks, and export demand may change between crop years.
How the curve works in practice
Each point on the curve represents a standardized futures contract traded on an exchange. For US grains, that usually means CME Group contracts such as corn, soybeans, wheat, oats, and rough rice. For canola, market participants often watch ICE canola futures. In Europe, some participants follow Euronext milling wheat and rapeseed futures as benchmark contracts.
These contracts are financial and standardized. They specify contract size, quality standards, delivery locations or delivery mechanisms, and expiry months. The market continuously updates prices based on order flow, crop expectations, macro conditions, export business, weather, funds positioning, and spreads between months.
The curve matters because grain is storable. If grain can be stored, the relationship between nearby and later months often reflects the economics of holding inventory. Those economics include:
- commercial storage charges,
- on-farm storage costs,
- interest or financing cost,
- insurance and shrink,
- quality deterioration risk,
- expected basis change,
- freight and logistics constraints.
If later futures months are higher than nearby months, the market may be offering carry. If nearby months are higher than later months, the market may be in inverse, which often signals stronger immediate demand, tighter nearby stocks, or logistical stress.
| Curve feature | What it usually means | Why users care |
|---|---|---|
| Upward slope | Deferred months priced above nearby months | Suggests storage carry may be available, depending on basis and costs |
| Downward slope | Nearby months priced above deferred months | Can signal tight prompt supply or urgent nearby demand |
| Flat curve | Little difference between months | Storage incentives may be limited unless basis is expected to improve |
| Sharp crop-year gap | Old-crop and new-crop fundamentals differ materially | Important for hedging harvest grain versus remaining old-crop inventory |
Contango, backwardation, carry, and inverses
In financial language, an upward-sloping curve is often called contango, while a downward-sloping curve is called backwardation. In practical grain trade language, many people simply talk about carry and inverse.
Carry is not automatically profitable. A farmer or merchant comparing December corn futures with March corn futures still has to ask:
- What does storage cost for that period?
- What is the interest cost on unsold inventory?
- Will local basis improve or weaken?
- Is the grain quality stable enough to hold?
- What are the freight and opportunity costs?
An inverse can also be misleading if looked at in isolation. Nearby futures may be high, but local elevators could widen basis or impose delivery restrictions if space is tight. A strong nearby board price does not guarantee a strong local cash bid.
Futures curve versus cash grain market
This distinction is critical. The futures curve exists on a regulated exchange. The physical grain market exists through country elevators, cooperatives, grain merchants, processors, feed mills, ethanol plants, crushers, exporters, and importers. The two are related but not identical.
A local cash price is usually:
Cash price = relevant futures month price + local basis
Basis reflects local supply and demand, freight, handling margins, quality differences, and delivery point. A corn grower in Iowa, an exporter at the Gulf, and a feed mill buyer in another country may all reference the same futures market while trading very different physical prices.
| Market type | Where it exists | What price represents | Who uses it |
|---|---|---|---|
| Futures market | Regulated exchanges such as CME Group, ICE, Euronext | Standardized contract value for a delivery month | Hedgers, traders, processors, merchandisers, funds |
| Cash market | Elevators, cooperatives, mills, crushers, exporters, merchants | Actual local bid or negotiated grain transaction | Farmers, buyers, feed users, exporters, importers |
| Basis market | Local cash trade tied to exchange futures reference | Difference between local cash and futures | Commercial grain trade, hedgers, producers |
Where to find and check a grain futures curve
The curve can usually be checked online through exchange websites, broker platforms, market-data terminals, charting software, and agricultural analytics tools. The exact display may appear as a quote board, spread matrix, or “forward curve” view.
Common places to check it
- Exchange websites: CME Group, ICE, and Euronext publish contract listings, delayed quotes in many cases, specifications, settlement information, and expiry calendars.
- Futures brokers: Broker platforms usually provide live or near-live quotes depending on account permissions and exchange data agreements.
- Market-data vendors: Professional users often rely on commercial charting and analytics systems for spread charts, historical curves, and seasonal comparisons.
- Farm marketing software: Some platforms aimed at farmers and merchandisers combine futures prices, basis, local bids, and hedge-tracking tools.
- Cash grain networks: Elevator or cooperative bid sheets may not show a full futures curve, but they often show the futures reference month used for local contracts.
For local cash comparison, farmers and physical traders usually check:
- elevator and cooperative websites,
- bid lines and merchandiser offers,
- processor bid sheets,
- official agricultural market reporting services where available,
- broker or advisory services that aggregate local basis and bids.
Delayed exchange prices can be enough for education, but active trading or intraday hedging generally requires a brokerage account with market-data access.
How farmers, grain companies, and traders use the curve
The same curve serves different purposes depending on the user.
Farmers
Farmers use the curve to decide whether to sell at harvest, store grain, hedge deferred delivery, or lock in futures now and basis later. A common question is whether the carry from one contract month to another covers on-farm storage and financing cost.
Elevators and cooperatives
Country elevators monitor the curve to set hedge positions, origin bids, storage programs, and basis offers. If the market has carry, they may hedge inventory and try to earn merchandising margin through storage and basis management.
Processors and feed buyers
Flour mills, feed manufacturers, ethanol plants, crushers, and other processors use the curve to estimate input cost by period. They may buy cash grain, hedge futures, or use options to protect against adverse moves while preserving some flexibility.
Exporters and merchants
Exporters compare futures months with port basis, vessel schedules, freight, and destination demand. A strong nearby export program can flatten or invert portions of the curve, especially if logistics are strained.
Speculators and spread traders
Financial traders may not intend to handle physical grain at all. They can trade individual futures contracts or calendar spreads between months. This is still regulated exchange trading, not a physical grain purchase.
How to analyze a grain futures curve step by step
A practical analysis usually starts with one crop and one exchange benchmark.
- Pick the relevant contract set. For US corn, soybeans, or wheat, that often means CME Group months. For canola, many watch ICE canola. Use the benchmark that your local trade references.
- Separate old crop from new crop. Grain markets often price remaining old-crop stocks differently from the coming harvest.
- Measure the month-to-month spreads. Compare nearby versus deferred contracts, such as March versus May or July versus December.
- Compare spreads with storage economics. Include interest, handling, shrink, aeration, insurance, and likely basis path.
- Check cash basis locally. A good-looking futures carry can be offset by weak basis or freight.
- Review current fundamentals. Look at stocks, export pace, weather, crop condition, and processing margins.
- Monitor delivery and expiry timing. A hedge placed in one month may need to be rolled before first notice day or expiry, depending on the strategy and contract.
Users who want a deeper view often chart the curve over time rather than on one day only. A curve that is steepening, flattening, or flipping from carry to inverse can matter more than the absolute shape on a single date.
Key reports and data sources that influence the curve
The futures curve moves when the market reassesses supply, demand, or logistics. Some of the most watched inputs are public reports and exchange data.
- USDA WASDE: Widely used for global and US balance-sheet changes in corn, wheat, soybeans, and other major crops.
- USDA Crop Progress: Important during planting and growing season, especially when weather risk is high.
- USDA Grain Stocks and Acreage reports: Often major curve-moving events because they reshape old-crop and new-crop expectations.
- USDA Export Sales: Useful for judging demand pace, especially for export-oriented crops.
- CFTC Commitments of Traders: Shows futures and options positioning by trader category and can help explain speculative pressure on the curve.
- Exchange volume, open interest, and settlement data: Useful for spread activity, contract liquidity, and curve structure.
- National agriculture ministries and statistical agencies: Relevant outside the US for acreage, production, trade, and stocks data.
- Port, freight, and logistics information: Commercial services and trade reporting can show whether physical bottlenecks are affecting nearby premiums.
Public reports explain part of the story, but local basis and logistics often require direct market contact with elevators, merchants, processors, or brokerage research.
Trading and hedging using the curve
If someone wants to trade the curve itself, that is normally done through futures spreads on a regulated exchange via a futures broker. This requires a brokerage account approved for futures trading, exchange data access, and enough capital to meet margin requirements. The trader is not buying a truckload of corn or soybeans; they are trading price exposure between standardized contract months.
If a farmer or grain buyer wants to hedge physical grain, the process is different:
- Identify the physical exposure, such as grain in storage or expected harvest production.
- Choose the exchange contract month that best matches the expected sale or purchase period.
- Place the hedge through a futures broker or, in some cases, use a forward contract, hedge-to-arrive contract, or basis contract through an elevator or merchant.
- Monitor basis separately from futures.
- Roll or lift the hedge as the physical sale or purchase approaches.
Common risks include:
- Basis risk: Local cash moves differently from futures.
- Margin calls: Futures hedges can require additional cash even if the physical side later benefits.
- Liquidity differences: Some contract months trade more actively than others.
- Mismatch risk: The benchmark futures contract may not perfectly track the local crop or delivery zone.
- Quality and logistics risk: Physical grain can face grade issues, moisture limits, freight delays, or storage losses that futures do not capture directly.
Limits of the futures curve
The curve is powerful, but it does not tell you everything. It does not automatically show local bid levels, barge freight, rail congestion, export lineups, quality discounts, or the exact value of specialty traits and grades. It also does not guarantee that storing grain is profitable.
In some regions, a futures benchmark may be imported from another country or exchange and then adjusted through basis and currency. That means local users should also track exchange rate exposure, import parity or export parity, and domestic policy changes where relevant.
Is the grain futures curve the same as the cash price farmers receive?
No. The futures curve shows exchange-traded contract prices by month. Farmers are usually paid a local cash bid from an elevator, cooperative, processor, or merchant. That cash bid reflects the futures reference plus or minus basis, along with quality, freight, and delivery terms.
Where can I see a grain futures curve online?
You can usually see it on exchange websites such as CME Group, ICE, or Euronext, and on broker trading platforms or commercial market-data systems. Exchange sites often provide contract quotes and specifications, while brokers and data vendors may provide spread and curve views.
Can I use the curve to decide whether to store grain?
Yes, but not by itself. Compare the carry between months with your storage, interest, shrink, insurance, and expected basis movement. A higher deferred futures price does not automatically mean storage is profitable.
How do traders actually trade the curve?
They usually trade calendar spreads between two futures months through a regulated futures exchange using a futures broker. This is a financial trade, not a physical grain transaction.
Which reports matter most for the curve?
For major grains, USDA reports such as WASDE, Crop Progress, Grain Stocks, Acreage, and Export Sales are widely followed. Traders also watch CFTC positioning data and exchange statistics such as volume and open interest.
Why can the nearby month trade above later months?
This often happens when the market needs grain immediately. Tight stocks, strong export demand, processing demand, or logistics problems can create an inverse, where nearby futures trade at a premium to deferred futures.
Can a farmer hedge without delivering on the exchange?
Yes. Most hedgers offset their futures position before delivery. They then sell or buy physical grain separately through the cash market using elevators, cooperatives, processors, or merchants.
What is the biggest mistake when reading a grain futures curve?
Confusing futures carry with guaranteed storage profit, or assuming the board price is the same as the local bid. Basis, freight, timing, grade, and storage costs can change the outcome materially.
Sources
- CME Group
- United States Department of Agriculture
- U.S. Commodity Futures Trading Commission