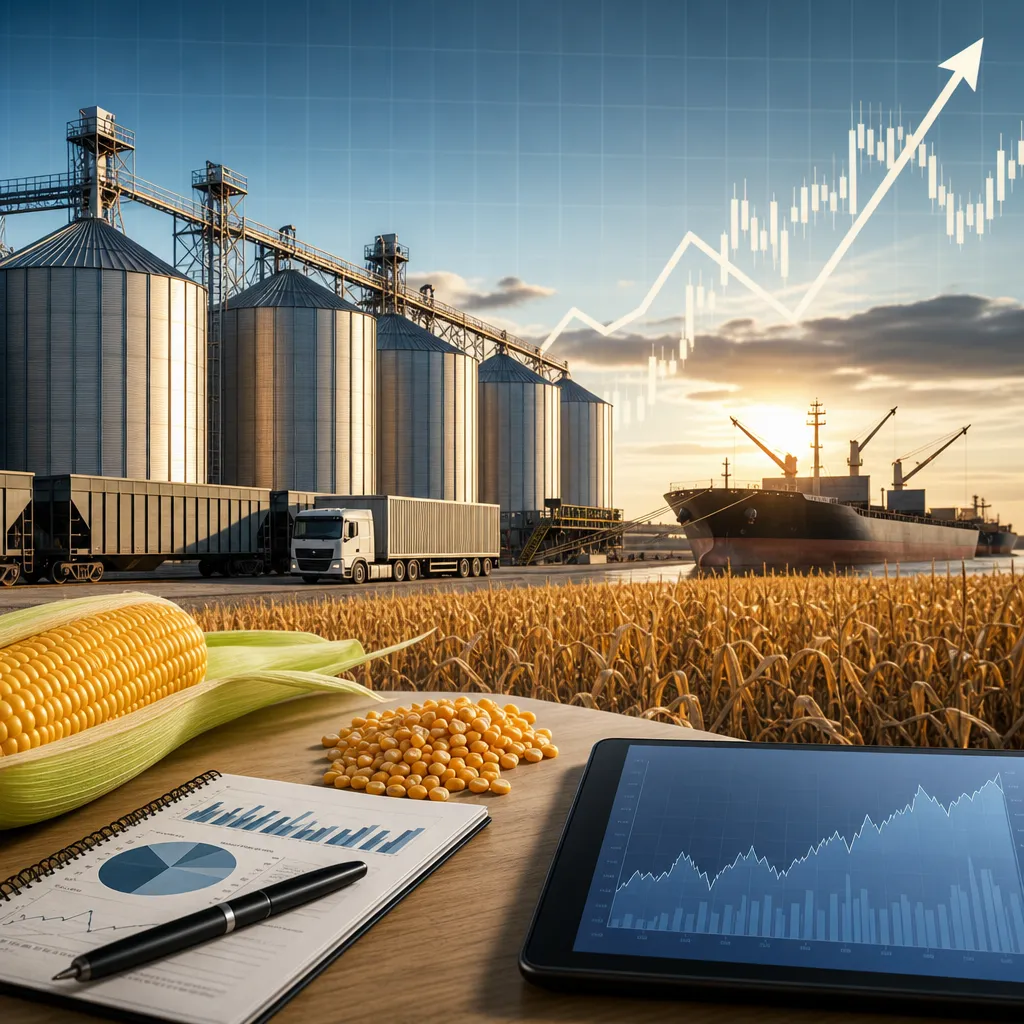


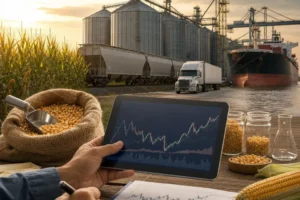
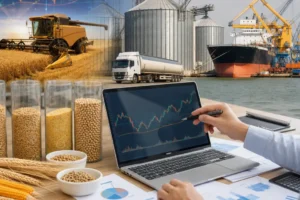
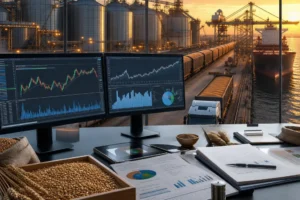
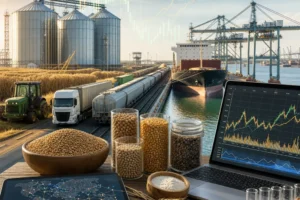

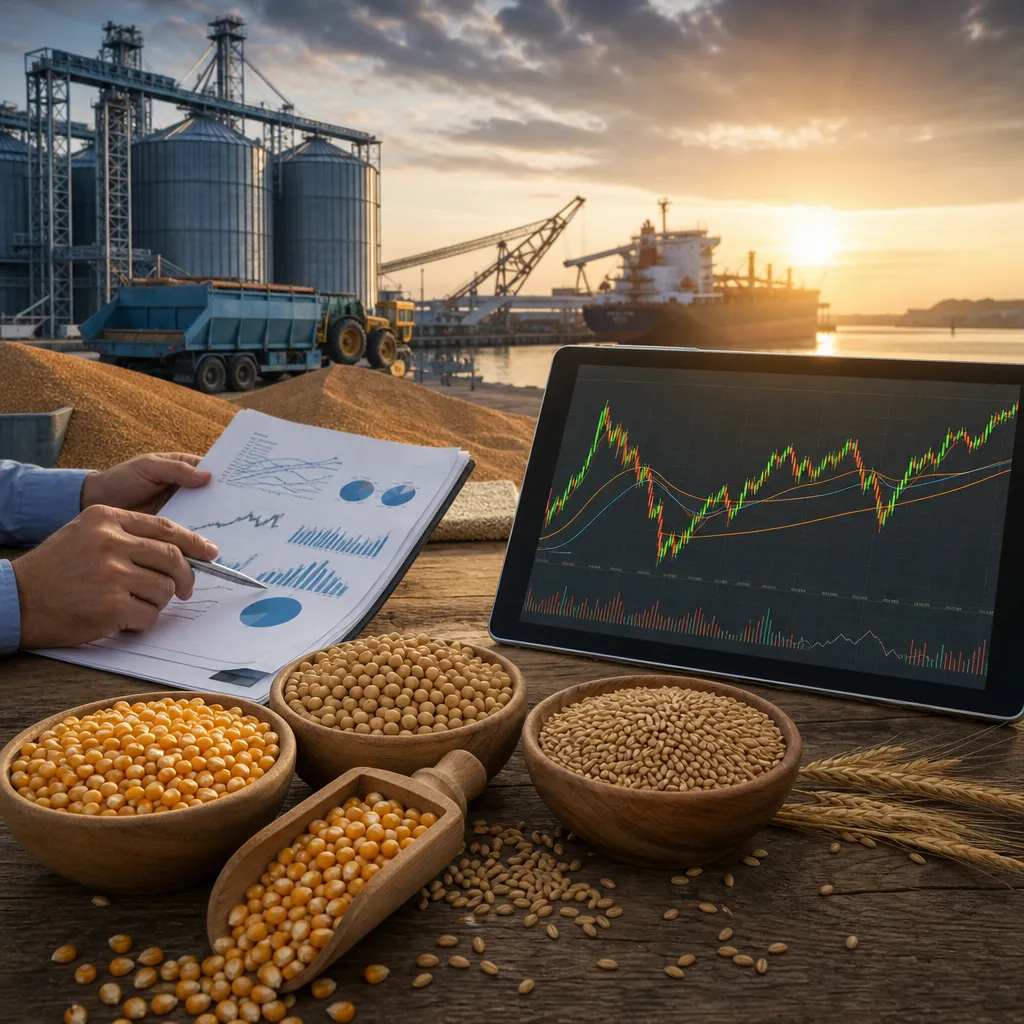
Grain chart patterns are recurring price formations seen on grain futures charts and, sometimes with caution, on local cash price charts. Traders use them to organize market behavior into practical setups such as trends, reversals, breakouts, and consolidations. In grain markets, these patterns matter most when they are combined with crop fundamentals, basis, seasonality, and risk management rather than used alone. A corn, wheat, or soybean chart can suggest timing, but the actual trade or hedge still depends on where you are operating: a regulated futures exchange, an options account, or a physical grain contract with an elevator, cooperative, merchant, or processor.
In practice, you will usually find grain chart patterns on futures charts from exchanges and broker platforms, not on the cash bid sheet posted by a local elevator. The benchmark charts most market participants watch are listed grain futures, especially contracts traded on CME Group. Farmers, hedgers, merchants, and speculators then compare those futures moves with local basis and cash bids to make selling, buying, hedging, or storage decisions.
What grain chart patterns are and why they matter
A chart pattern is a visual structure formed by price over time. In grain markets, these structures are usually built from daily, weekly, or intraday futures prices for crops such as corn, soybeans, soybean meal, soybean oil, Chicago wheat, Kansas wheat, Minneapolis wheat, oats, canola where relevant on its home exchange, and sometimes rice.
The reason chart patterns are useful is simple: grain prices often respond in waves to the same recurring forces. Weather scares create fast rallies. Harvest pressure creates heavy selling. USDA reports can trigger gaps or breakout moves. Export demand can confirm an uptrend. If enough market participants see similar levels of support, resistance, prior highs, or breakout points, their buying and selling can reinforce the pattern.
That said, a grain chart pattern is not a forecast guarantee. Grain is unusually sensitive to fast-changing information such as rainfall, yields, freight disruptions, government policy, crop condition reports, and currency moves. A technically bearish chart can reverse quickly if drought intensifies or export demand improves.
Where grain chart patterns are actually used
The main place chart patterns are used is the listed futures market. For many global grain participants, benchmark price discovery happens on regulated exchanges. In the United States, the most widely watched grain futures are on CME Group. Traders access those contracts through futures brokers and trading platforms, while analysts may view delayed or end-of-day charts on exchange, broker, or market-data sites.
Physical grain markets use chart patterns more indirectly. A farmer delivering corn to an elevator is not selling a chart pattern; the farmer is selling a local cash bid. But many elevators, cooperatives, processors, feed mills, and grain merchants build their bids from futures plus or minus basis. So if December corn futures break above resistance, the local bid may improve, although not necessarily by the same amount because basis can strengthen or weaken independently.
| Market type | Where it exists | What chart patterns are used for | Who typically uses it |
|---|---|---|---|
| Futures market | Regulated exchange access through a futures broker and trading platform | Trade timing, hedging decisions, stop placement, breakout and reversal analysis | Speculators, hedgers, commercial traders, analysts |
| Options on futures | Exchange-listed options accessed via a broker | Choosing strike areas, timing hedges, structuring limited-risk strategies | Farmers, elevators, processors, traders |
| Local cash grain market | Elevators, cooperatives, merchants, mills, feed companies, processors | Marketing timing only, usually alongside basis, storage, and delivery decisions | Farmers, grain buyers, merchandisers |
| OTC physical contracts | Direct negotiated contracts with merchants, exporters, processors, importers | Reference for timing and benchmark pricing, not a stand-alone execution tool | Commercial firms, large producers, importers, exporters |
Common grain chart patterns and how they work
The most useful grain chart patterns are the ones that help with market structure and risk control, not the most exotic ones. Four broad categories matter most.
Trend patterns
An uptrend is a sequence of higher highs and higher lows. A downtrend is lower highs and lower lows. Grain traders often use trendlines and moving averages to confirm the pattern, but the pattern itself is visible directly on price. In a weather-driven corn rally, for example, traders may buy pullbacks within an uptrend rather than chase the market after a large daily move.
Support and resistance ranges
Many grain contracts spend long periods in sideways trade while the market waits for acreage, weather, harvest results, or export confirmation. Support is the price area where buying repeatedly appears. Resistance is where selling repeatedly appears. These zones often matter around USDA reports because a surprise can trigger a range breakout.
Reversal patterns
Head-and-shoulders tops, double tops, double bottoms, and rounded bottoms are classic reversal structures. In grain, they are more reliable when they form over a meaningful time period and when fundamentals support the change. A double bottom in wheat after a period of heavy global selling may matter more if export demand also starts to improve.
Continuation patterns
Flags, pennants, and triangles suggest a pause within a larger move. They are common in grains after a sharp weather rally or a panic selloff. The key practical point is not the pattern name but whether volume, follow-through, and fundamental context support the breakout.
| Pattern type | What it suggests | How grain users apply it | Main limitation |
|---|---|---|---|
| Trend | Direction is established | Scale sales, hedge in stages, trade pullbacks | Can reverse abruptly on weather or policy news |
| Range | Market is waiting for new information | Buy or sell near edges, prepare for breakout | False breakouts are common |
| Reversal | Prior trend may be ending | Adjust hedges, reduce exposure, watch confirmation levels | Often identified clearly only after the move starts |
| Continuation | Pause within a larger move | Re-enter trend, tighten stop logic, time option hedges | Breakout direction may differ from expectation |
How to read chart patterns in grain markets correctly
The first step is to identify the exact market and contract month. Corn, soybeans, and wheat do not trade as one single continuous price. There are multiple futures months, and each can behave differently depending on carry, storage economics, and delivery timing. A pattern in nearby soybeans may look different from a new-crop soybean contract.
The second step is to know the unit and currency. US grain futures are commonly quoted in cents per bushel. Other grain and oilseed contracts may use metric tons and local currency. Physical contracts may use bushels, short tons, metric tons, or local trade measures. A chart pattern only becomes usable when you know what is actually being priced.
The third step is to confirm with context. In grain markets, context includes:
- USDA reports such as WASDE, Crop Progress, Grain Stocks, and Acreage
- Export demand and weekly sales data
- Weather forecasts during planting, pollination, filling, and harvest
- Basis movement at elevators, river terminals, mills, crushers, and ports
- Spreads between nearby and deferred futures months
- CFTC positioning, especially in heavily traded contracts
A chart breakout during a quiet period means one thing. The same breakout on the day of a major crop report means something else entirely.
Where to find grain charts, prices, and confirming data
For futures charts, the primary reference point is the exchange itself. CME Group publishes contract specifications and market information for major US grain futures and options. Many broker platforms provide live or delayed charting, order entry, technical indicators, and historical data, depending on account type and data permissions.
If you are a farmer or commercial buyer, local cash prices usually come from elevators, cooperatives, merchants, processors, ethanol plants, feed mills, crushers, or exporters. These bids may be posted on company websites, mobile apps, bid sheets, text alerts, or through direct communication with a merchandiser. Those local cash bids matter more for physical selling than a chart alone.
For report-based confirmation, the most widely used public sources include USDA for US crop and grain reports, CFTC for Commitments of Traders positioning data, and official exchange data for contract details. Outside the US, readers may use national agriculture ministries, official statistics agencies, or grain exchanges in their own regions for local crop and price information.
Commercial data vendors and charting platforms may add intraday analytics, news, weather overlays, export flow data, and basis tools. These are often used by elevators, larger farms, trading desks, and procurement teams, but users should verify whether the data is delayed, estimated, or exchange-licensed.
How chart patterns are used for trading, hedging, and cash marketing
Speculative trading and commercial hedging are not the same activity, even if both use the same futures chart. A speculative trader may buy a wheat breakout through a futures account and manage the position with margin and a stop-loss. A farmer may use that same breakout as a signal to forward sell part of expected production to an elevator or to place a hedge in futures while leaving basis open.
For hedging, the chart pattern is mainly a timing tool. The real objective is risk transfer. A corn producer, for example, may hedge with futures or buy put options when a seasonal rally reaches resistance or when a support break suggests downside risk. A processor or feed buyer may lift hedges or extend coverage if a base pattern signals strengthening prices.
If you are trading futures, you normally need a regulated futures brokerage account, appropriate market-data permissions, and enough capital to meet margin requirements and withstand volatility. If you are selling physical grain, you normally need a commercial relationship with an elevator, cooperative, merchant, or processor, along with clear agreement on moisture, grade, delivery window, location, freight responsibility, and payment terms.
It is important not to confuse online futures execution with physical grain movement. Clicking “sell” on a futures platform does not move a truckload of wheat. Delivering physical grain requires logistics, grading, and settlement under a cash or forward contract.
Limits, risks, and common mistakes
The biggest mistake is treating chart patterns as self-sufficient. Grain markets can invalidate technically clean setups with one report, a weather change, or a policy announcement. A breakout in soybeans may fail if South American weather improves or if export demand weakens.
Another mistake is ignoring basis. A farmer might correctly identify a bullish corn chart but still receive a disappointing local cash price if basis weakens due to local oversupply, storage congestion, freight problems, or weak processor demand. Futures direction and local merchandising conditions are connected but not identical.
Leverage is another major risk. Futures trading involves margin, and small percentage moves can create large gains or losses relative to account size. Options limit some risks but involve time decay and premium cost. In cash marketing, chart-based decisions also carry risk if storage costs, quality deterioration, or delayed sales offset any later futures gain.
A practical rule is to use chart patterns as one layer in a decision stack. Combine them with cash-flow needs, storage capacity, crop condition, basis history, report timing, and written risk limits.
A practical workflow for using grain chart patterns
- Choose the right benchmark. Use the futures contract that best matches the crop and marketing period you are analyzing.
- Check local bids. Compare exchange price action with bids from elevators, cooperatives, or processors in your area.
- Mark support, resistance, and trend. Focus on obvious levels first.
- Review report timing. Note upcoming USDA releases, export reports, and major weather periods.
- Decide the objective. Are you speculating, hedging, pricing grain, or managing storage risk?
- Select the instrument. Futures, options, forward cash contract, hedge-to-arrive, or delayed-pricing arrangements depending on availability and suitability.
- Define risk. For futures, this means stops and margin tolerance. For physical grain, it means basis risk, quality risk, and carrying cost.
- Monitor confirmation. Watch follow-through, volume where available, basis movement, and spread behavior.
Are grain chart patterns useful for farmers selling cash grain?
Yes, but mainly as timing aids. Farmers are paid local cash prices, not just futures prices, so chart patterns should be used together with basis, storage economics, delivery terms, and local demand.
Where can I check grain charts online?
Benchmark grain futures charts are commonly checked through exchange information from CME Group, through futures brokers, and through market-data/charting providers. Local cash bids are usually checked through elevator, cooperative, merchant, or processor bid pages and direct merchandiser communication.
Do chart patterns work better on futures than on cash grain bids?
Usually yes. Futures markets are more standardized and liquid, so patterns are generally clearer. Cash grain bids include basis, freight, local supply pressure, and buyer-specific demand, which can distort the chart.
What is the difference between a grain futures chart and a local elevator bid?
A futures chart shows exchange-traded benchmark prices for a standardized contract. A local elevator bid is a physical purchase offer at a specific location, quality standard, and delivery period, usually built from futures plus or minus basis.
Can I trade grain chart patterns without ever handling physical grain?
Yes. Futures and options allow financial trading of grain price exposure through a regulated broker account. That is different from buying, storing, transporting, or delivering actual grain.
Which reports should I check before acting on a chart pattern?
For US grain markets, USDA reports such as WASDE, Crop Progress, Acreage, Grain Stocks, and Export Sales are key. CFTC Commitments of Traders data can also help show how funds and commercials are positioned.
Why does a bullish futures chart not always mean a better cash price locally?
Because basis can weaken. Local supply, river conditions, export terminal demand, processor outages, storage pressure, and freight costs can all reduce the local cash bid even when futures rise.
Are chart patterns enough to build a grain hedging plan?
No. A hedging plan also needs production estimates, cash-flow timing, contract choice, basis strategy, delivery planning, and risk limits. Charts help with timing, but they do not replace merchandising discipline.
Sources
- USDA Agricultural Marketing Service
- CME Group
- U.S. Commodity Futures Trading Commission