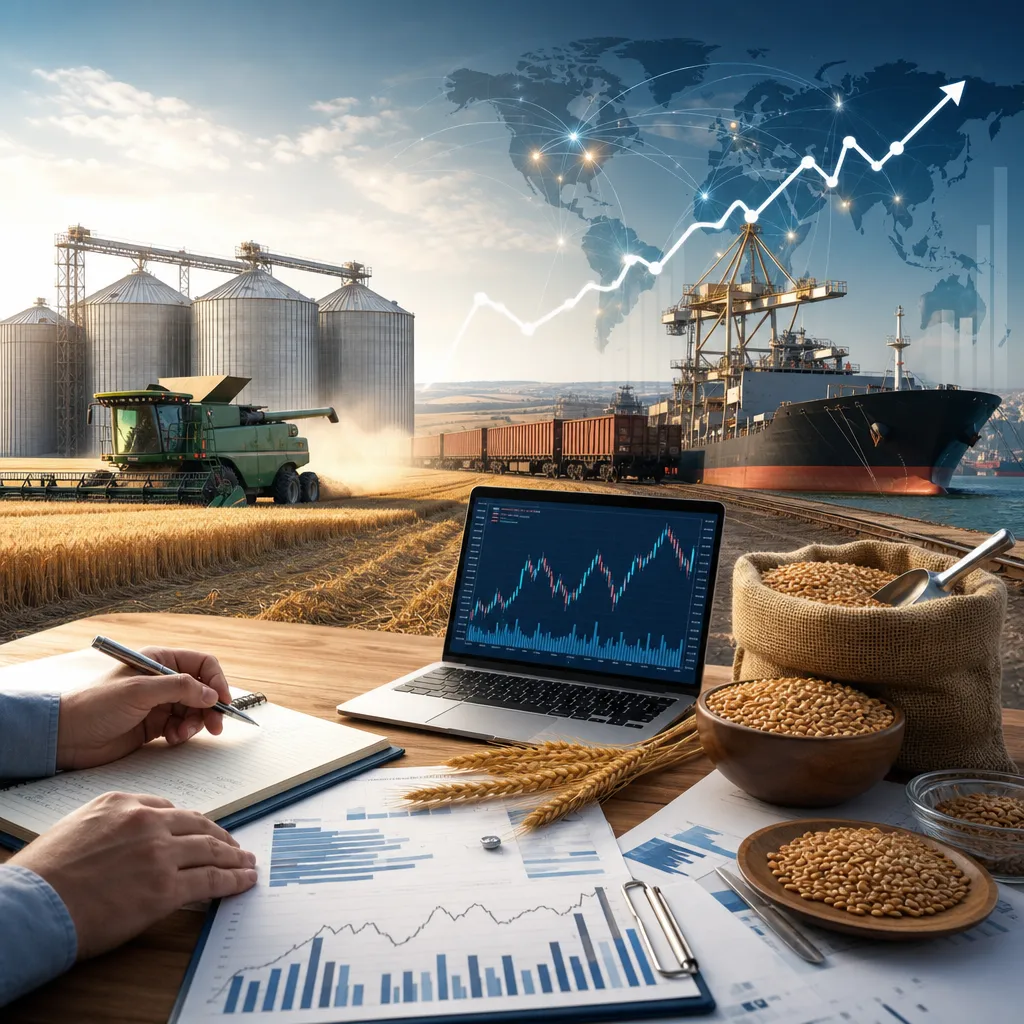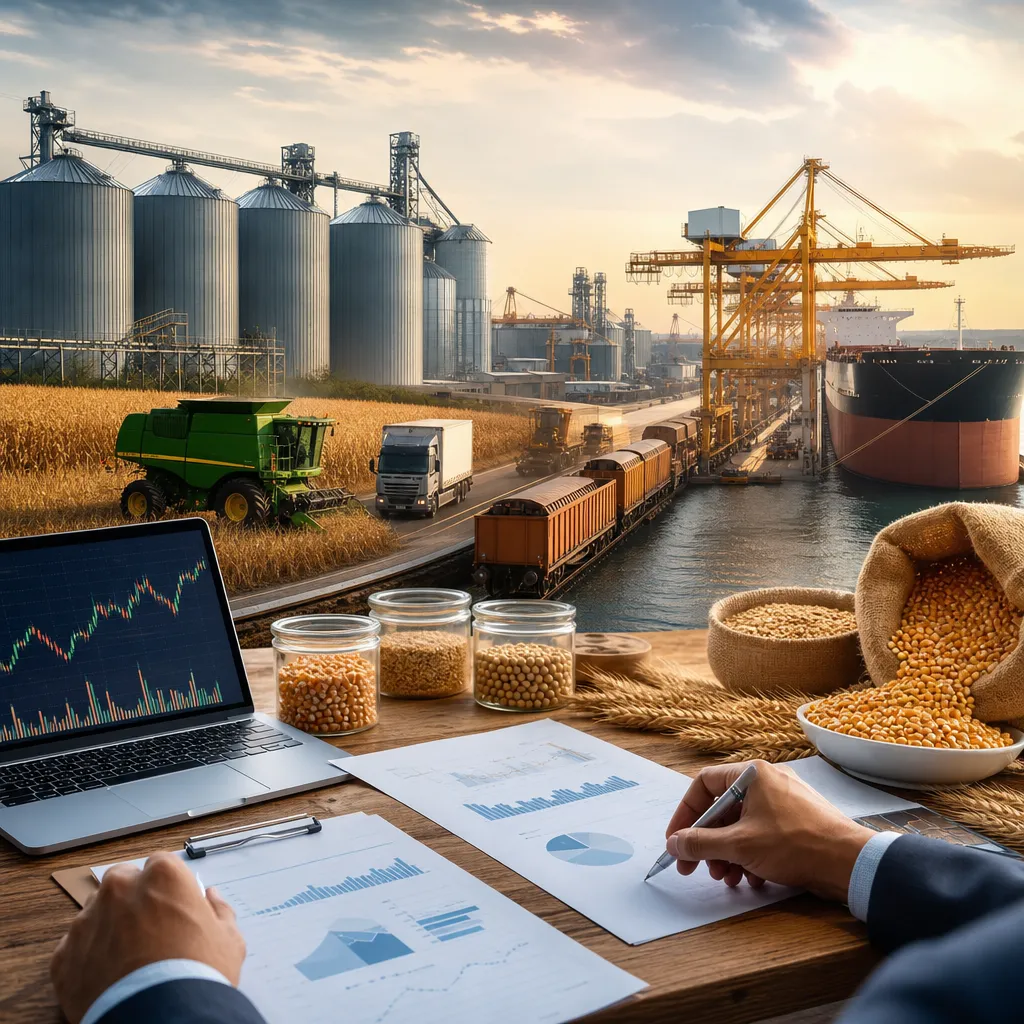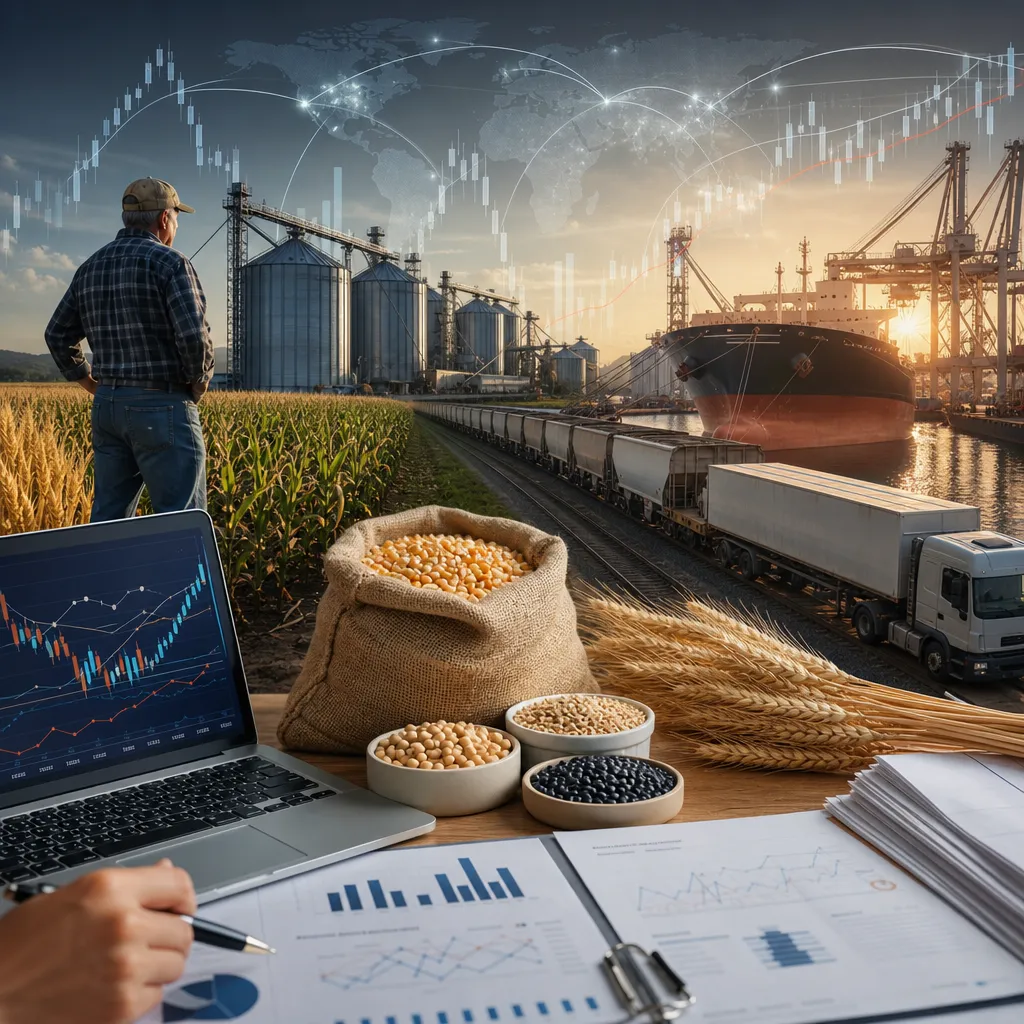


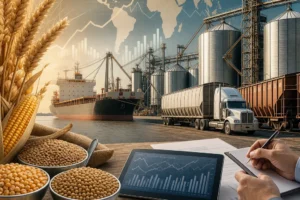
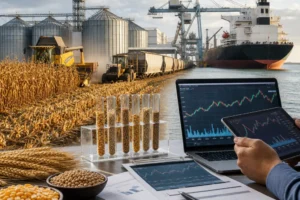

Global grain demand is the combined need for wheat, corn, rice, soybeans, barley, sorghum, oats, rye, canola, rapeseed, and other grains and oilseeds across food, animal feed, fuel, and industrial uses. In practice, it is not a single number traded in one place; it is observed through consumption data, import demand, export programs, processing margins, feed rations, and price behavior in both physical and futures markets. Readers who want to understand it need to separate global benchmarks from local cash markets, because demand may look strong on an exchange screen while local bids remain weak due to freight, storage pressure, or quality issues. The most reliable way to track grain demand is to combine official reports, exchange prices, local basis bids, and real-world logistics signals such as vessel lineups, export inspections, crushing activity, and feed demand.
What global grain demand actually means
Global grain demand measures how much grain and oilseed the world wants to consume, process, import, or hold in inventory over a period of time. It includes direct human consumption, livestock feed, ethanol and biodiesel production, industrial starch and sweetener use, and strategic or commercial stockbuilding.
Different crops respond to different demand channels. Wheat demand is driven mainly by food and feed. Corn demand is heavily influenced by feed and ethanol. Soybean demand is linked to crushing into meal and oil, so livestock production and vegetable oil markets matter. Rice is more directly tied to food consumption and government policy. Canola and rapeseed depend on crush margins, edible oil demand, and in some regions biofuel policy.
Demand is global, but grain moves through regional systems. A large importer may buy cargoes at port, a feed mill may buy truckloads from a local merchant, and a futures trader may only trade price risk on a regulated exchange without ever handling physical grain.
How global grain demand works in the real market
Demand shows up first as buying behavior. Importers issue tenders, crushers bid for soybeans, mills buy wheat with specific protein levels, feed manufacturers switch formulations, and exporters book rail and vessel capacity. These actions affect physical bids. Futures prices react too, but futures are benchmarks for risk transfer, not a complete picture of physical demand.
In the physical market, grain demand is usually expressed through:
- Local elevator or cooperative bids for immediate or deferred delivery
- Processor bids from flour mills, feed mills, ethanol plants, crushers, or maltsters
- Export bids at river terminals, ports, or inland loading points
- Import tenders issued by state agencies or private buyers
- Spot and forward contracts negotiated directly between commercial counterparties
In the financial market, demand is reflected indirectly through futures spreads, options volatility, and price relationships across delivery months. These are traded on exchanges through brokers, clearing members, and trading platforms. That is very different from physically buying a truckload, railcar, barge lot, or vessel cargo of grain.
| Market type | What it shows | Where it happens | Who uses it |
|---|---|---|---|
| Futures market | Benchmark price and risk transfer | Regulated exchanges such as CME Group | Hedgers, traders, funds, merchants, processors |
| Cash market | Actual local buy-sell value | Elevators, cooperatives, mills, crushers, exporters | Farmers, buyers, merchants, end users |
| Export market | Port demand and international trade flow | FOB ports, tenders, merchant networks | Exporters, importers, state agencies |
| OTC physical contracts | Negotiated quality, freight, and delivery terms | Direct commercial trade | Merchants, processors, large farms, feeders |
Where to check global grain demand and related market data
The best public starting point is official agricultural reporting. For world supply and demand balances, the key source is the USDA WASDE report. It provides global estimates for production, consumption, ending stocks, and trade by crop and country. Analysts use it to judge whether demand is accelerating, rationing, or shifting between origins.
For shorter-term U.S. signals that influence global trade, market participants also watch:
- USDA Export Sales for weekly committed export demand
- USDA Export Inspections for actual shipment pace
- USDA Crop Progress for production risk affecting supply-demand balance
- USDA Grain Stocks for inventory availability
For exchange pricing, CME Group is a major benchmark venue for corn, wheat, soybeans, soybean meal, soybean oil, oats, canola-linked risk management by correlation, and related agricultural contracts. Exchange websites and broker platforms normally provide contract specifications, symbols, months, settlement information, and delayed or live data depending on account level.
For position data, the CFTC Commitments of Traders report shows how commercial hedgers and speculative funds are positioned in regulated U.S. futures markets. It is useful for sentiment, but it does not replace physical demand analysis.
For international food-market context, FAO publishes global food commodity assessments and cereal market monitoring. National ministries, customs authorities, port authorities, and statistical offices may also publish crop, trade, and logistics information relevant to regional demand.
How to interpret grain demand without confusing futures and cash prices
A common mistake is to assume that rising futures automatically mean strong local demand. Futures reflect a broad market consensus about expected balance sheets and risk, while local cash prices depend on basis, quality, storage pressure, freight, and nearby buyer competition.
To analyze demand correctly, compare:
- Futures price for the global or regional benchmark
- Basis or local premium/discount offered by an elevator, merchant, or processor
- Spread structure between nearby and deferred futures months
- Export pace from official shipment and sales reports
- Domestic processing margins such as crush, milling, or ethanol economics
If futures rise but basis weakens, supply may be trapped locally or freight may be expensive. If basis strengthens while futures are flat, nearby physical demand may be outbidding the broader market. If spreads invert, the market may be signaling a stronger need for immediate supply than for later delivery.
| Signal | What it may indicate | Where to check it |
|---|---|---|
| Stronger export sales | Improving international demand | USDA Export Sales and national trade data |
| Firm processor basis | Tight nearby local supply or strong plant demand | Local bids from crushers, mills, ethanol plants, elevators |
| Nearby futures premium | Urgent demand for prompt supply | Exchange futures curves |
| Weak feed margins | Possible rationing of feed grain demand | Commercial feed markets and industry reports |
| Lower crush margins | Possible reduction in soybean or canola processing demand | Processor bids, exchange products, oil and meal prices |
Main drivers of global grain demand
Demand is usually more stable than supply, but it still changes meaningfully when prices, incomes, currency moves, weather, and policy shift incentives.
Population and food consumption
Long-term demand growth comes from population and diet changes. Wheat and rice are especially sensitive to direct food consumption. This demand tends to be less volatile than feed or industrial use, but government trade restrictions or subsidy changes can alter import flows quickly.
Livestock feed demand
Corn, wheat, barley, sorghum, oats, and soybean meal compete in feed rations. Feed manufacturers and livestock producers adjust formulations based on relative prices, availability, and nutritional value. This means one grain can gain demand at the expense of another if price relationships change.
Biofuels and industrial processing
Ethanol demand affects corn. Biodiesel and renewable fuel policies can affect soybean oil, canola oil, rapeseed oil, and sunflower oil values, which then feed back into oilseed crushing demand. Industrial use can be highly policy-sensitive and often depends on energy prices.
Currency and import affordability
A weaker importing-country currency can reduce buying power even when world prices are steady. A weaker exporting-country currency can make its grain more competitive. That is why world demand is never just about absolute price; it is also about landed cost in the buyer’s market.
Freight and logistics
Ocean freight, barge movement, rail performance, truck availability, draft restrictions, port congestion, and container conditions all affect reachable demand. Grain can be cheap on paper and still uncompetitive after freight and handling.
Where physical grain is bought and sold when demand is strong
Physical grain trade normally happens through commercial channels rather than on a retail-style website. Farmers usually sell to grain elevators, cooperatives, merchants, feed mills, crushers, maltsters, ethanol plants, or exporters. Large buyers may also source directly from farms or through brokers.
The transaction usually includes these elements:
- Commodity and crop year
- Quantity
- Quality or grade, sometimes with protein, moisture, test weight, oil content, or damage limits
- Delivery point, such as on-farm pickup, elevator, plant, rail terminal, or port
- Price formula, often futures plus or minus basis, or a flat cash price
- Delivery window
- Freight responsibility
- Weights, inspection, and settlement terms
Export trade is more complex. Merchants and exporters aggregate supply inland, move it by truck, rail, or barge to terminal facilities, then sell on international trade terms such as FOB or CIF depending on the contract structure. Importers may buy through private negotiation or public tender. Government grain boards or state purchasing agencies are still relevant in some countries.
Storage and quality matter. A market may appear to have demand, but grain that does not meet grade, moisture, or contamination standards can be heavily discounted or rejected. Warehouses and grain handling facilities therefore play a critical role in keeping grain marketable.
How futures and options are used to manage demand-related price risk
Futures and options are commonly used to hedge the price impact of changing grain demand, but they do not replace physical procurement or physical sales contracts. A corn processor may buy physical corn from local suppliers while also using futures to manage flat price risk. A farmer may hedge expected production with futures, then later finalize basis with an elevator. An importer may use futures or OTC swaps while separately negotiating a cargo purchase.
To access exchange-traded futures or options, users normally need a regulated futures broker or a commercial clearing relationship. Trading occurs on exchange-linked platforms, not by calling a local elevator for a hedge account. Physical delivery through futures is possible in some contracts, but most commercial users offset or roll positions and settle physical needs separately in the cash market.
Key risks include:
- Margin calls on futures positions
- Basis risk between local cash grain and the futures benchmark
- Liquidity differences across contracts and delivery months
- Contract specification mismatch with local quality or location
- Options premium cost and time decay
For many businesses, the practical hedge question is not just “Is demand rising?” but “Which part of my price exposure comes from global futures and which part comes from local basis and freight?”
How farmers, buyers, and analysts can track demand in practice
A workable routine combines public reports with local commercial intelligence.
For farmers
- Check local bids from elevators, cooperatives, processors, and nearby end users
- Compare cash prices with relevant futures months
- Watch basis trends before and after harvest
- Follow export sales and major crop balance-sheet updates
- Ask buyers about delivery slots, quality premiums, and storage terms
For feed buyers, mills, and processors
- Monitor nearby basis and freight in your procurement zone
- Track substitution economics among corn, wheat, barley, sorghum, and meals
- Use futures or options where appropriate to manage flat price exposure
- Review crop quality and availability, not just benchmark prices
For traders and analysts
- Use USDA WASDE for global context
- Use CFTC positioning for market structure, not as a standalone demand measure
- Watch spreads, basis, export pace, and processing margins together
- Cross-check exchange signals with port activity and physical offers
Limits of global grain demand analysis
Demand is often estimated rather than directly observed in real time. Official balance sheets are revised. Import demand can shift between origins without changing total world consumption. Prices may move on weather or policy long before demand data confirms a trend.
There is also a timing issue. Futures react instantly, export registrations appear later, vessel loadings later still, and final consumption may only become clear months afterward. That is why good grain analysis uses scenarios rather than certainty. Strong demand can be overwhelmed by a very large crop, while modest demand can still support prices if stocks are tight or logistics are constrained.
Where can I check global grain demand data?
The main public source is USDA WASDE for world supply, use, trade, and ending stocks by crop and country. FAO also provides international cereal and food commodity analysis. For shorter-term commercial signals, use USDA Export Sales, Export Inspections, and exchange market data from CME Group.
Where are grain prices quoted?
Benchmark futures prices are quoted on regulated exchanges such as CME Group. Local physical grain prices are quoted by elevators, cooperatives, merchants, mills, crushers, ethanol plants, and exporters as cash bids or basis levels. The local cash price is not the same as the futures quote.
How do I know whether demand is affecting my local cash market?
Watch local basis, delivery queues, processor bids, and freight conditions. If nearby buyers are increasing basis or offering stronger premiums for quality and prompt delivery, local demand is likely improving even if futures are unchanged.
Can I buy or sell physical grain online?
Some transactions begin through digital merchandising tools or commercial marketplaces, but physical grain trade usually still depends on negotiated terms, delivery locations, grade standards, freight, and settlement conditions. Most farmers and commercial buyers work through established elevators, cooperatives, merchants, processors, or brokers.
Where does futures trading fit into grain demand?
Futures help transfer price risk and provide a benchmark for the market’s view of supply and demand. They are traded through regulated brokers and exchanges. They do not automatically represent local delivery value, and trading futures is different from buying or selling actual grain.
What reports matter most for wheat, corn, and soybean demand?
USDA WASDE is the core report for global balance sheets. USDA Export Sales is important for near-term export demand. For soybeans and canola-type markets, crush demand and vegetable oil trends are also critical. For corn, feed and ethanol demand are especially important.
What are the biggest risks when relying on demand analysis?
The main risks are confusing futures with cash price, ignoring basis and freight, overlooking quality constraints, and treating official estimates as exact real-time truth. Demand can also shift between countries or between crops without showing up immediately in headline prices.
Why can grain demand look strong globally while local prices stay weak?
Because local prices depend on more than global demand. Harvest pressure, storage shortages, transportation bottlenecks, weak basis, poor quality, and long distance to export channels can all reduce local bids even when global consumption is healthy.
Sources
- USDA World Agricultural Supply and Demand Estimates (WASDE)
- CME Group agricultural futures contract information and market data
- FAO Food Outlook and AMIS market information resources