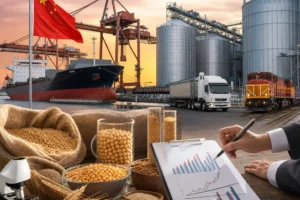

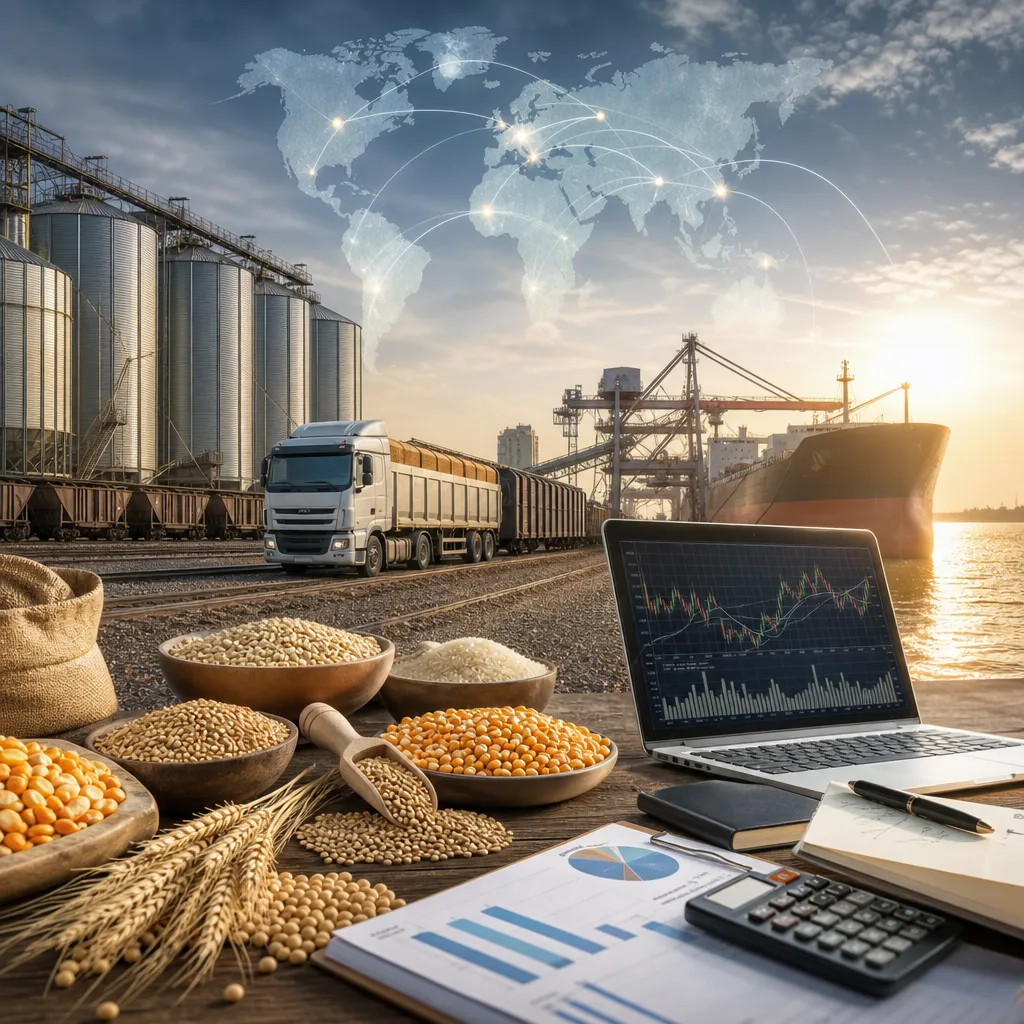
World grain consumption is the center of the agricultural economy because it determines how much wheat, corn, rice, soybeans, barley, sorghum, oats, rye, and oilseeds the market must produce, move, store, and price. In practice, grain consumption is not a single number on one website: it is estimated from food use, livestock feed, industrial processing, biofuels, seed demand, and trade flows. Readers who want to understand it need to know both where the official data comes from and how physical demand turns into prices, basis levels, freight demand, and hedging activity. The most reliable way to follow global grain consumption is to combine official supply-and-demand reports with local cash market information, futures prices, and regional trade signals.
What world grain consumption means
World grain consumption usually refers to the total amount of grain and oilseed products used over a marketing year across all major consuming regions. Analysts often separate this into several categories.
- Food use: grain eaten directly by people, especially rice and wheat.
- Feed use: grain consumed by livestock and poultry, especially corn, barley, sorghum, wheat, and oats.
- Industrial use: grain processed into ethanol, starch, sweeteners, beverages, or other products.
- Crush or processing demand: soybeans, canola, rapeseed, and sunflower seed processed into meal and oil.
- Seed and residual: grain reserved for planting or adjusted for handling losses and statistical balancing.
Consumption matters because it interacts directly with production, ending stocks, and trade. If production grows faster than use, stocks tend to build and prices may weaken. If use grows faster than supply, stocks tighten and the market usually becomes more sensitive to weather, logistics, and policy changes.
How grain consumption is measured in practice
No one counts every bushel or metric ton consumed in real time. Instead, government agencies, exchanges, merchandisers, processors, and analysts estimate use from a chain of physical and statistical evidence.
For example, feed demand is inferred from livestock numbers, feed rations, slaughter pace, feed mill activity, and relative prices between corn, wheat, barley, and sorghum. Food use is estimated from population, per-capita consumption patterns, flour milling, rice distribution, and import needs. Industrial demand can be tracked through crushing volumes, ethanol production, biodiesel policy, and plant operating margins.
Global consumption figures are most commonly published in marketing-year balance sheets. These balance sheets usually show:
- Beginning stocks
- Production
- Imports
- Total supply
- Domestic use or total consumption
- Exports
- Ending stocks
The numbers are revised over time. That is why grain traders and commercial users watch not just the level of consumption, but also revisions from one report to the next.
| Consumption category | How it works | Who uses the information |
|---|---|---|
| Food use | Driven by population, diet, milling, imports, and domestic distribution | Governments, millers, importers, food companies |
| Feed use | Linked to livestock numbers, feed formulas, and relative feed grain prices | Feed mills, livestock producers, grain merchandisers |
| Industrial use | Includes ethanol, starch, sweeteners, and other processing demand | Processors, energy-linked users, analysts |
| Crush demand | Oilseeds processed into meal and vegetable oil | Crushers, feed buyers, vegetable oil traders |
| Seed and residual | Planting use plus losses, handling adjustments, and balancing items | Statisticians, market analysts, government agencies |
Where to find reliable world grain consumption data
The most practical public sources are official agricultural balance sheets and market reporting agencies. For global grain use, the standard starting point is the USDA.
USDA WASDE is one of the most widely used reports for world supply and demand. It provides global and country-level estimates for wheat, corn, rice, soybeans, and other key crops. Traders, analysts, exporters, and processors use it to compare production, use, exports, imports, and ending stocks across regions.
USDA Production, Grain: World Markets and Trade, Oilseeds: World Markets and Trade, and Feed Outlook add detail around the broader balance sheets. These reports help explain whether consumption changes are coming from feed ration shifts, crush margins, export demand, or production changes.
FAO publishes global food and agricultural statistics and market analysis. FAO material is especially useful for longer-term consumption trends, food security analysis, and international comparisons.
National statistical agencies and agriculture ministries provide domestic demand indicators such as animal inventories, flour milling statistics, industrial usage, and crop processing data. Examples include national grain boards, ministries of agriculture, or statistical offices.
Customs and trade data help confirm consumption trends indirectly. A country that consistently imports wheat, corn, or soybeans despite stable production is signaling domestic demand that local supply cannot fully cover.
Commercial users often combine official reports with subscription services, exchange data feeds, and private crop intelligence. These tools can improve timing, but they do not replace the basic need to understand the official balance sheet framework.
| Source type | What it provides | Where it is used |
|---|---|---|
| USDA WASDE | Global and country grain and oilseed supply-demand estimates | Trading desks, risk management, market analysis |
| FAO statistics and outlooks | Longer-term food and agricultural consumption trends | Policy, research, international comparison |
| National agencies | Domestic use, livestock, processing, crop balances | Regional market work, physical procurement |
| Customs and trade databases | Import and export flows by product and origin | Trade analysis, sourcing, demand verification |
| Exchange and broker data | Futures prices, spreads, volume, open interest | Price discovery and hedging, not direct consumption measurement |
Why consumption moves grain prices
Consumption does not set prices by itself, but it is one of the strongest drivers of price direction over time. Markets focus especially on whether demand is steady, weakening, or rationing itself at higher prices.
For corn, a rise in feed demand or ethanol demand can tighten supply quickly. For wheat, food demand is usually relatively stable, but feed substitution can change when wheat becomes cheaper or more expensive relative to corn and barley. For soybeans, crush demand depends on both animal feed meal demand and vegetable oil demand. Rice demand is usually more tied to food consumption and government stock policies than speculative industrial demand.
Price effects often show up in several layers:
- Futures market: benchmark prices on exchanges such as CME Group react to changes in expected supply and use.
- Cash market: local elevator bids, processor bids, and export bids adjust based on nearby demand, freight, and basis.
- Spreads: nearby contracts may strengthen relative to deferred contracts when immediate demand is urgent.
- Basis: local demand can increase cash bids even if futures are unchanged.
This distinction is essential. A stronger world consumption outlook may lift exchange futures, but the actual local price a farmer receives depends on basis, delivery point, quality, and freight. A futures quote is a benchmark, not automatically the farmgate price.
How the physical grain market reflects consumption
World grain consumption becomes real through physical buying by mills, crushers, feed manufacturers, ethanol plants, exporters, and state or private importers. These buyers usually do not acquire grain on an exchange screen in the same way a financial trader buys a futures contract. They buy physical grain through cash contracts.
In practice, physical grain transactions often pass through:
- Country elevators and local cooperatives
- Merchants and originators
- Processors such as flour mills, feed mills, crushers, and ethanol plants
- Terminal elevators and export houses
- Importers, tender systems, and brokers in destination markets
A typical transaction includes crop type, quality standards, moisture limits, protein or oil parameters where relevant, delivery period, delivery location, weight and grade rules, freight responsibility, and payment terms. In export markets, contracts may be negotiated using Incoterms and may involve port elevation, vessel loading windows, inspection certificates, and marine freight.
Someone analyzing world consumption should therefore watch not only global balance sheets, but also:
- Export lineups at major ports
- Domestic processor bid levels
- Import tenders from major buyers
- Rail, truck, barge, and vessel logistics
- Warehouse and silo capacity
- Quality issues that make some grain less usable
World consumption and futures markets: related but not the same
Grain futures are the main financial instruments used to hedge or speculate on grain price risk. Major benchmark contracts trade on regulated exchanges, most notably CME Group for Chicago wheat, corn, soybeans, soybean meal, soybean oil, oats, and other agricultural products. European and regional exchanges may also be important depending on the crop and origin.
These contracts represent standardized quality, quantity, delivery terms, and contract months. They are useful because they create transparent price discovery and can be traded through a regulated futures broker. But they are not the same as buying physical grain for immediate use.
Commercial users hedge consumption exposure in several ways:
- Buyers such as feed mills or processors may buy futures to protect against rising prices before they physically purchase grain.
- Farmers or grain owners may sell futures to protect inventory or expected production.
- Options users may buy calls or puts to cap risk while keeping some flexibility.
To trade futures or options, a user normally needs an account with a regulated futures broker or introducing broker clearing through a futures commission merchant. This is an online financial market activity, not a physical grain purchase. It involves margin, mark-to-market cash flows, contract expiration, and basis risk. A perfect hedge is rare because local cash prices do not move exactly one-for-one with exchange futures.
Key drivers of future grain consumption
Forecasting world grain consumption requires a scenario approach. Demand can be resilient, but it is not fixed.
- Population and income growth: supports food grain demand and, indirectly, meat consumption that lifts feed use.
- Livestock production: changes feed grain demand for corn, barley, wheat, sorghum, and protein meals.
- Biofuel policy: affects corn, sugar, vegetable oils, and sometimes feed co-product balances.
- Relative prices: users switch between feed ingredients when one grain becomes cheaper versus another.
- Currency moves: weaken or strengthen import affordability.
- Government intervention: tariffs, quotas, food security buying, or export restrictions can reshape trade and domestic use.
- Weather and crop quality: poor quality wheat, for example, may move from food channels to feed channels.
- Freight and logistics: even strong demand can slow if port congestion, rail disruption, or high ocean freight reduces trade flow.
Analysts often pay close attention to stocks-to-use. This ratio compares ending stocks with total use and is a practical measure of how comfortable or tight supply is relative to consumption. Low stocks-to-use generally means the market has less buffer against shocks.
How farmers, buyers, and analysts can use consumption data
Farmers can use world consumption data to judge whether a market is structurally demand-supported, but they should combine it with local basis, elevator bids, storage economics, and quality premiums or discounts. A strong global demand story is not enough if local logistics are weak or if quality falls below contract specs.
Processors and feed buyers use the data to plan inventory coverage. If global use is rising and stocks are tightening, they may increase forward coverage or hedge input costs. If demand appears to be rationing, they may buy more slowly and watch nearby spreads.
Traders and merchandisers use consumption trends to interpret futures structure, spreads, export demand, and basis opportunities. They also compare report-based demand with real pipeline evidence such as sales pace, crush data, and vessel loading.
Analysts and researchers use consumption figures to build balance sheets, regional comparisons, and scenario models. The best practice is to cross-check multiple sources rather than relying on one headline number.
Common mistakes when reading world grain consumption
One common mistake is to treat “consumption” as exact measured reality. In many countries it remains an estimate and may be revised significantly.
Another mistake is to confuse rising futures prices with rising physical consumption. Markets can move on weather, fund positioning, currency changes, or policy headlines before demand data confirms anything.
A third mistake is to ignore the difference between global demand and local marketing conditions. A farmer sells into a local cash market shaped by basis, trucking cost, storage availability, grade, and delivery terms, not just world balance sheets.
Finally, many readers focus on production headlines and underestimate demand composition. A crop can look large overall but still produce a tight usable supply if quality is poor or if a larger share is absorbed by food, feed, or biofuel channels than expected.
Where can I check world grain consumption figures?
The most widely used public starting point is USDA WASDE. FAO also provides global agricultural statistics and market analysis. For domestic detail, check national ministries of agriculture, grain boards, or official statistical agencies.
Does world grain consumption tell me today’s local grain price?
No. It helps explain broad market direction, but local cash prices depend on futures, basis, freight, quality, storage, and delivery point. Farmers usually check nearby elevator or cooperative bids, processor bids, and regional market reporting services.
Where does physical grain buying and selling actually happen?
Usually through grain elevators, cooperatives, merchants, feed mills, flour mills, crushers, ethanol plants, exporters, and import tenders. Contracts are negotiated around quality, quantity, delivery period, and location. This is separate from buying a futures contract online.
Where does grain futures trading take place?
On regulated commodity exchanges through a licensed or regulated futures broker, depending on jurisdiction. Major benchmark agricultural contracts trade on CME Group. Users need a brokerage account and must manage margin and contract risk.
What is the difference between futures prices and cash grain prices?
Futures prices are standardized exchange benchmarks. Cash prices are the actual offers or bids for physical grain in a specific place and quality. The difference between them is called basis, and it changes with local supply, demand, and logistics.
How do importers and exporters use grain consumption data?
They use it to estimate whether a country will need imports, whether domestic stocks are sufficient, and whether exportable surplus may tighten. They then combine that view with port logistics, freight markets, quality availability, and government policy.
Can I trade world grain consumption directly?
No. You can trade grain futures or options, negotiate physical grain contracts, or invest in businesses affected by grain demand. Consumption itself is an economic variable, not a tradable asset.
Why do grain consumption estimates change after publication?
Because agencies revise feed demand, trade flows, processing use, livestock numbers, and stock estimates as new information becomes available. Balance sheets are updated rather than fixed forever.
Sources
- USDA World Agricultural Supply and Demand Estimates
- Food and Agriculture Organization of the United Nations
- CME Group Agricultural Products