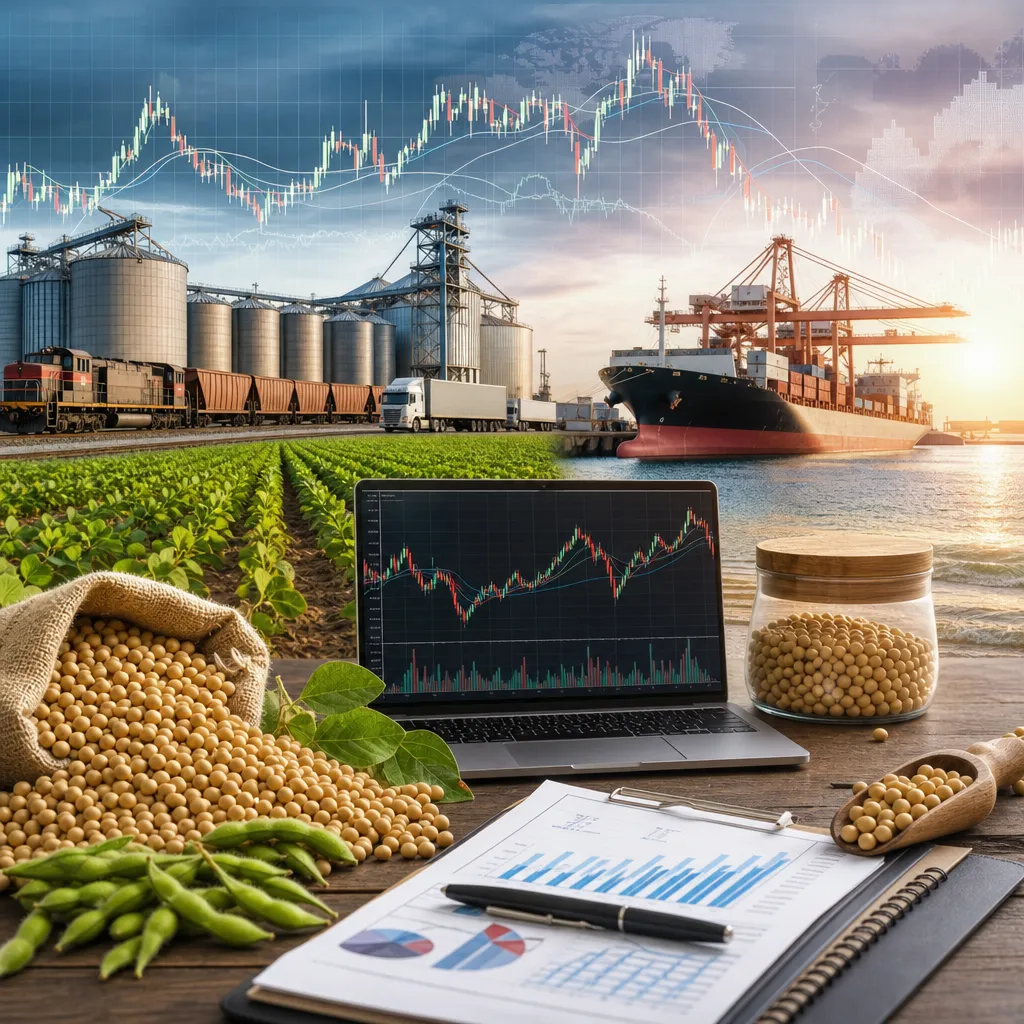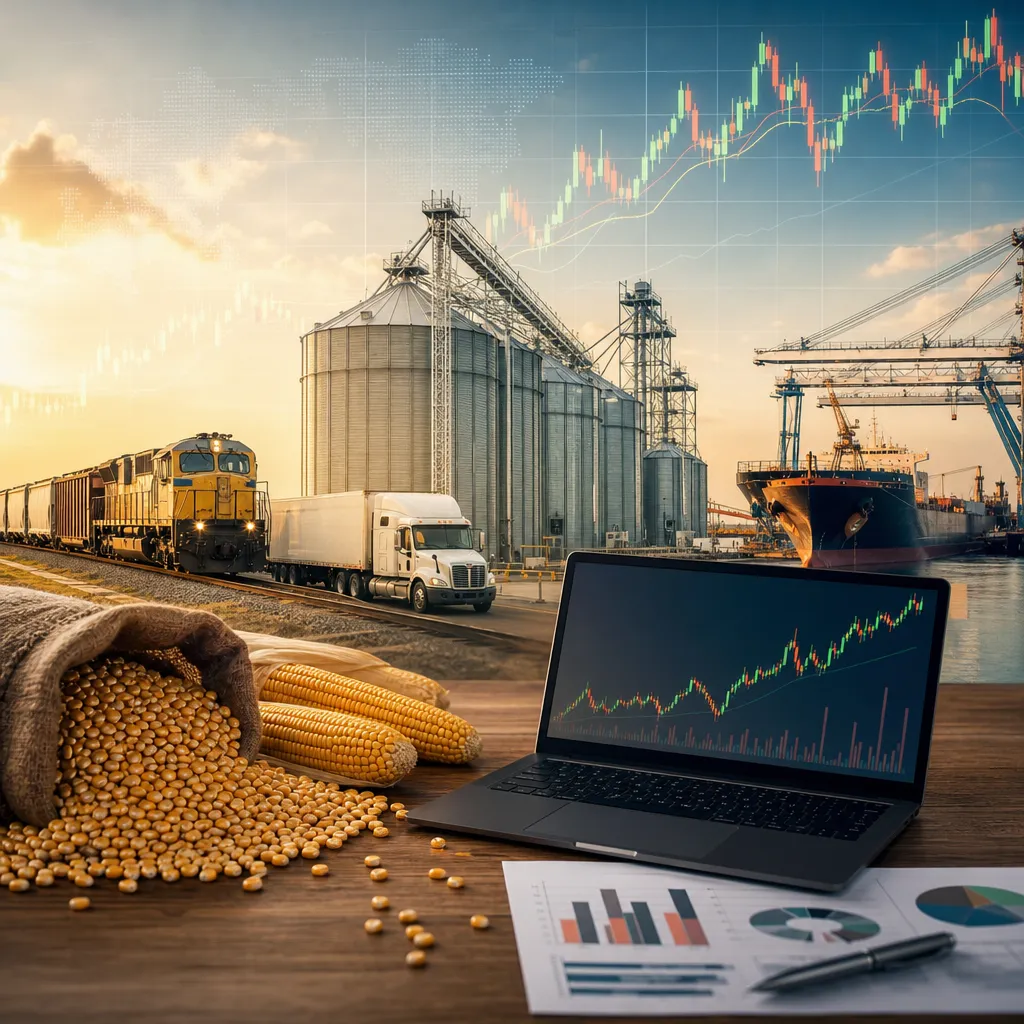


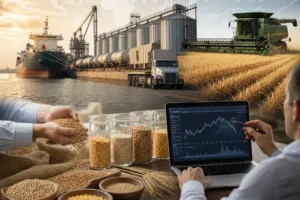
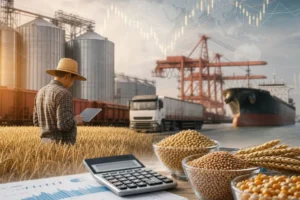
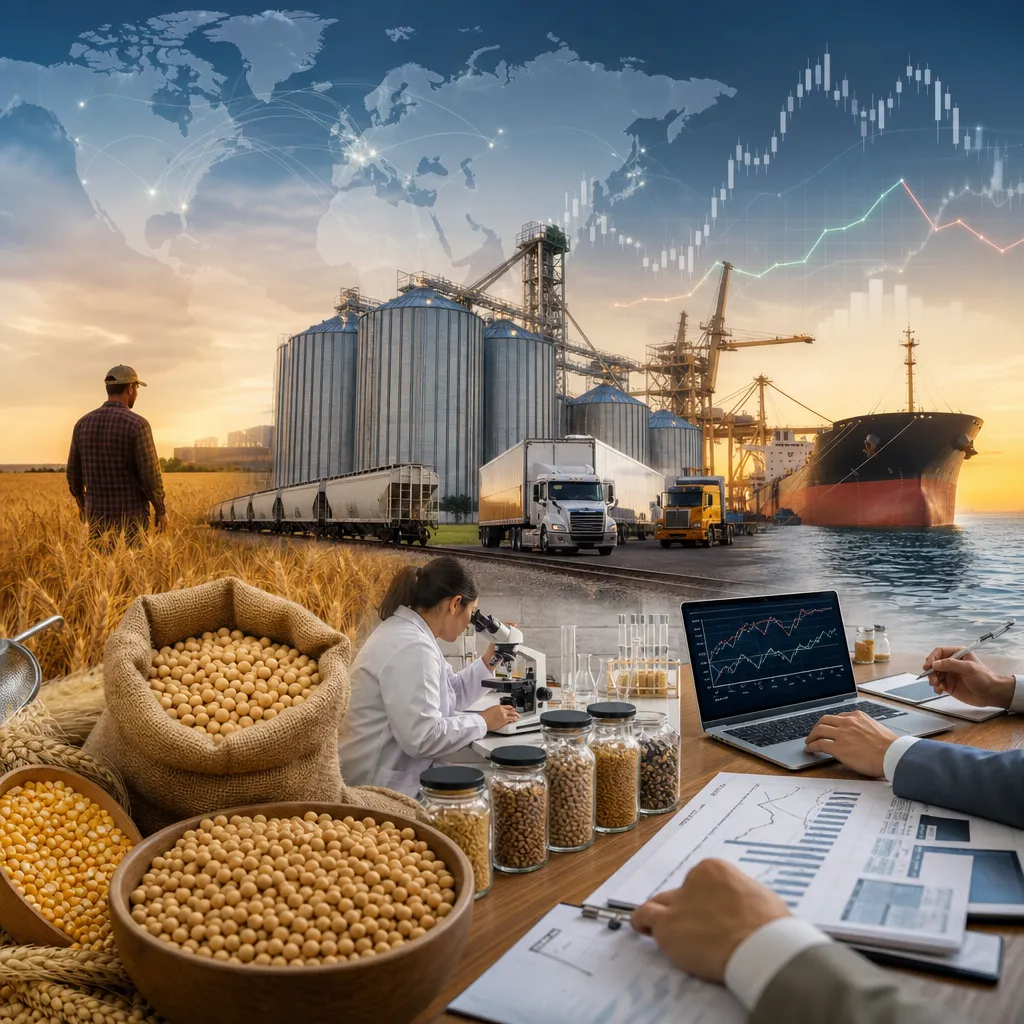
The United States grain supply and demand balance is the core framework used to understand how much corn, soybeans, wheat, and other grains the country produces, uses, stores, imports, and exports. In practice, it matters to farmers, elevators, feed mills, ethanol plants, exporters, processors, futures traders, and overseas buyers because it influences both futures prices and local cash bids. The market operates across the entire U.S., but pricing is closely tied to major crop regions such as the Corn Belt, Plains, Mississippi River system, Pacific Northwest export corridor, and Gulf export terminals. To follow this market properly, readers need to distinguish between national supply-and-demand estimates, exchange-traded futures prices, and the local physical prices actually paid for grain.
In the U.S., the main grains and oilseeds discussed in supply-and-demand terms are usually corn, soybeans, wheat, sorghum, barley, oats, and sometimes rice, although rice is often analyzed separately. Prices are commonly discussed in U.S. dollars, with futures quoted in cents or dollars per bushel for many crops, while export trade and some physical contracts are often discussed in dollars per metric ton or short ton depending on the commodity and buyer. The most widely watched benchmark for grain futures is the Chicago Board of Trade, now part of CME Group, but local cash markets can differ materially from futures because location, quality, transport, and buyer demand all matter.
What “U.S. grain supply and demand” means
At the national level, supply and demand is a balance sheet. On the supply side, the market looks at beginning stocks, current crop production, and imports. On the demand side, it tracks feed use, food use, seed use, industrial processing, biofuel demand where relevant, exports, and ending stocks.
For corn, the market usually focuses on feed demand, ethanol and industrial use, exports, and ending stocks. For soybeans, attention centers on crush demand, exports, and soybean meal and oil demand. For wheat, domestic food use, feed use, export competitiveness, and class-specific availability matter. The relationship between total supply and total use helps shape whether the market appears tight, balanced, or burdensome.
In U.S. market practice, no single number determines price by itself. A large crop can still coexist with firm prices if exports are strong or stocks are already tight. Likewise, a weather scare can lift prices even before final production is known, because futures markets price expectations well ahead of harvest.
Where the market operates inside the United States
The U.S. grain market is national, but it is not uniform. Corn and soybeans are concentrated in the Midwest and broader Corn Belt, including states such as Iowa, Illinois, Indiana, Minnesota, Nebraska, and Ohio. Hard red winter wheat is strongly associated with the central and southern Plains, while spring wheat is more important in the northern Plains. Soft red winter wheat is more relevant in parts of the eastern Corn Belt and mid-South, and durum is more specialized.
Physical grain moves through a large commercial network of country elevators, river terminals, rail loaders, feed mills, flour mills, crushers, ethanol plants, and export terminals. The most important export pathways often include the Gulf through the Mississippi River system and the Pacific Northwest for certain flows, especially to Asian buyers. Domestic prices can vary sharply between an inland elevator, a processor bid, and an export terminal bid even on the same day.
The market also operates financially through futures and options listed on CME Group exchanges, especially CBOT contracts for corn, soybeans, soybean meal, soybean oil, and several wheat contracts across U.S. wheat classes. Those futures provide benchmarks, but they are not the same as farm-gate prices.
How grain prices are formed in the United States
U.S. grain prices are formed through the interaction of benchmark futures prices and local cash basis. The benchmark futures market reflects national and global expectations about production, stocks, weather, demand, policy, and macro conditions. The local cash market reflects what a specific buyer at a specific location is willing to pay for physical grain of a certain quality for immediate or forward delivery.
Futures price is the exchange-traded reference price for a standardized contract month. It is used for price discovery and hedging.
Cash bid is the local physical price offered by an elevator, ethanol plant, crusher, mill, or feed buyer. It is often expressed as futures plus or minus basis.
Basis is the difference between local cash price and the relevant futures contract. A basis can strengthen when local demand is strong or logistics are tight, and weaken when harvest pressure is heavy or transport costs rise.
Delivered price usually means the price including transport to a specified destination such as a feed mill, processing plant, or export terminal.
FOB price refers to grain priced free on board at an export point, commonly used in international trade discussions. It is not the same as the farm price.
CIF price includes cost, insurance, and freight to the destination port, and is more relevant to importers than to inland U.S. sellers.
| Price type | Where quoted | What it means |
|---|---|---|
| Futures price | CBOT/CME trading platform and broker screens | Benchmark price for a standardized future delivery month |
| Local cash bid | Elevators, cooperatives, processors, local merchants | Physical grain price for a specific location, quality, and delivery period |
| Basis | Quoted by local buyers against a futures month | Difference between local cash bid and futures benchmark |
| Delivered price | Commercial contracts between buyer and seller | Price including delivery to a named destination |
| FOB export price | Export trade and market commentary | Price at export point before ocean transport |
| CIF import price | Import tenders and destination trade | Price delivered to importing destination with freight and insurance |
Because of this structure, a farmer in Iowa, a poultry feeder in Georgia, and an exporter at the Gulf can all react to the same CBOT futures move while seeing very different local prices. That is normal, not a pricing error.
How supply and demand shifts affect prices
The most important U.S. grain price drivers usually begin with acreage, yield, and weather. Planting pace, summer rainfall, heat stress, disease pressure, and harvest conditions can all shift production expectations. USDA crop progress and crop condition reporting often matter because they influence yield expectations before final production is known.
Demand-side shifts differ by commodity. Corn is highly sensitive to livestock feeding margins, ethanol economics, and export competition. Soybeans depend heavily on crush margins, vegetable oil demand, renewable fuels policy relevance, and export demand. Wheat pricing can be driven by protein quality, class-specific supplies, weather in the Plains, and competition from other major exporters.
Stocks are the balancing item that often decides whether the market feels comfortable or tight. Low ending stocks generally increase the market’s sensitivity to weather or logistic disruptions. High stocks can limit rallies unless demand improves sharply.
Currency and freight also matter. A stronger U.S. dollar can reduce export competitiveness, while river disruptions, rail constraints, or high barge costs can widen basis in some locations and strengthen it in others. Energy prices and fertilizer costs can influence production decisions and next-season acreage.
| Factor | Likely market effect | Why it matters |
|---|---|---|
| Large harvested area or high yields | Can pressure futures and harvest-time cash bids | Increases available supply |
| Weather stress during key growth stages | Can support or rally futures | Raises concern about lower production |
| Strong export demand | Supports futures and export basis | Reduces domestic availability |
| Weak river or rail logistics | Can weaken some inland bids and distort basis | Raises transport costs and slows movement |
| High crush, feed, or ethanol demand | Supports local processor bids and sometimes futures | Improves domestic consumption |
| Stronger U.S. dollar | Can weigh on exports | Makes U.S. grain less competitive abroad |
Where to check U.S. grain prices and market information online
Readers looking for current market information should separate futures prices from physical bids. For exchange-traded benchmark prices, CME Group is the primary official reference for CBOT grain and oilseed futures and options. Brokers and market platforms may display live or delayed quotes depending on the account and data permissions.
For U.S. cash market context, local elevators, cooperatives, grain merchants, ethanol plants, soybean crushers, feed mills, and exporters often publish bids directly to producers or commercial counterparties. Those bids are location-specific and may be available through company websites, apps, grain origination platforms, or direct account access. A national futures quote should never be treated as the exact local cash price.
For supply-and-demand fundamentals, USDA is the central institutional source. The most closely watched publications are the World Agricultural Supply and Demand Estimates, National Agricultural Statistics Service crop reports, and weekly export sales or crop progress releases. These reports are widely used by commercial grain firms and futures traders because they standardize the national balance-sheet discussion.
For broader market oversight and positioning, CFTC data can help readers understand how futures and options market participants are positioned, although that is not a direct physical grain price source. Export buyers and analysts also watch USDA Foreign Agricultural Service material and official inspection or export reporting.
How grain is actually bought and sold in the physical U.S. market
Physical grain trade in the U.S. usually takes place through commercial channels rather than through the futures exchange. Farmers sell to local buyers such as country elevators, cooperatives, ethanol plants, crushers, feed mills, flour mills, or merchants. The contract may be spot, forward, basis-only, hedge-to-arrive, minimum-price, storage-related, or another commercial format depending on the counterparties and the season.
A physical grain sale typically specifies the commodity, quantity, quality terms, delivery window, location, and pricing method. Protein, moisture, test weight, damage, and foreign material may affect final settlement depending on the crop and buyer. Payment timing and title transfer are commercial contract issues and should not be confused with futures trading.
Export grain is assembled inland, moved by truck, rail, or barge, elevated into terminal systems, and sold by exporters to overseas buyers under international trade terms. The inland seller may see a basis linked to export demand, but the final export transaction may be priced FOB Gulf, FOB Pacific Northwest, or under another destination-related structure. That export price is commercially connected to inland grain values, but it is not the same as an elevator bid in farm country.
How grain is traded or hedged through U.S. futures and options
Futures and options trading in the U.S. grain market primarily occurs through CME Group contracts, accessed through a futures broker. These instruments are used by hedgers and speculators for different reasons. A hedger, such as a farmer, elevator, processor, or exporter, is usually trying to reduce price risk on physical grain exposure. A speculator is taking price risk without necessarily owning or needing the physical commodity.
Buying a futures contract does not mean a trader has bought truckloads of grain in the countryside. Likewise, selling physical corn to an elevator does not automatically mean the farmer has traded on the exchange. The cash market and the futures market are linked, but they are not the same market.
Users should understand margin, leverage, contract expiry, and basis risk before using futures or options. Basis risk is especially important because a hedge can protect against benchmark futures price movement while still leaving the hedger exposed to a changing local basis. That is one reason many commercial market participants manage cash sales and futures positions together rather than separately.
U.S. export and import role in grain supply and demand
The United States is one of the world’s major grain and oilseed exporters, especially in corn, soybeans, and wheat, although its competitive position varies by crop year and by destination. Export demand is central to the U.S. balance sheet because large changes in international buying can quickly alter domestic ending stocks expectations.
Imports are relatively less important for many major U.S. grains in national terms, but they can still matter in specialty classes, border regions, or specific feed and milling situations. Domestic users care less about the headline import number than about whether imported or substitute supplies change local competition.
Export business is heavily influenced by world prices, crop conditions in competing exporters, ocean freight, currency moves, and importer demand. U.S. Gulf and Pacific Northwest values are therefore connected to both inland basis and global trade conditions. When export channels are strong, inland bids near those channels or on efficient logistics routes may improve relative to more isolated regions.
Practical reading of U.S. grain supply and demand reports
A practical way to read the U.S. market is to compare four layers at the same time. First, track national supply-and-demand changes through USDA balance sheets. Second, follow benchmark futures for market expectations. Third, monitor local basis from nearby buyers. Fourth, watch logistics and export competitiveness.
Readers should not focus only on whether a crop is “big” or “small.” It is more useful to ask how that crop compares with beginning stocks, how fast it is being consumed, whether exports are meeting expectations, and whether local buyers need grain now or later. In many years, price weakness during harvest can coexist with better post-harvest basis if storage, transport, or processor demand later tighten local availability.
For forecasts, scenario thinking is better than certainty. A favorable weather and yield scenario may expand supplies and pressure prices, particularly if export demand disappoints. A tighter scenario could emerge if yields fall, acreage shrinks, or domestic and export use exceed expectations. The market usually adjusts through both futures and basis rather than through one price signal alone.
What is the main benchmark for U.S. grain prices?
The main benchmark is usually CBOT grain and oilseed futures at CME Group. These prices are the reference point for many cash bids, hedges, and market discussions, but they are not identical to local physical grain prices.
Where can I check current U.S. grain prices?
For benchmark futures, check CME Group or a licensed broker platform. For actual local cash bids, check elevators, cooperatives, processors, grain merchants, crushers, ethanol plants, or other physical buyers in the relevant region.
Why is my local cash bid different from the futures price?
Because local cash prices include basis. Basis reflects location, transport cost, storage, quality, buyer competition, and local supply-and-demand conditions. A local buyer may be above or below the benchmark futures market depending on those factors.
How do USDA reports affect the market?
USDA reports influence expectations about acreage, yield, production, exports, domestic use, and ending stocks. Futures markets often react quickly because those reports change the national supply-and-demand outlook.
How is grain physically sold in the U.S.?
Most physical grain is sold through commercial contracts with elevators, cooperatives, processors, feed mills, or exporters. Terms usually cover quantity, grade or quality, delivery point, delivery period, and pricing method.
Can I trade U.S. grain online without buying physical grain?
Yes. Futures and options can be traded through a regulated broker account, and many participants use them only for price exposure or hedging. That is different from owning, storing, or delivering physical grain.
What units are used in the U.S. grain market?
Futures and many domestic grain discussions often use bushels, while export markets and some commercial transactions may use metric tons or short tons. Prices are usually denominated in U.S. dollars.
What are the biggest drivers of U.S. grain supply and demand?
Key drivers include planted area, weather, yield, harvest pace, export demand, feed demand, ethanol or crush economics, stocks, dollar strength, and transport conditions such as river, rail, or port efficiency.
Sources
- USDA World Agricultural Outlook Board
- USDA National Agricultural Statistics Service
- CME Group