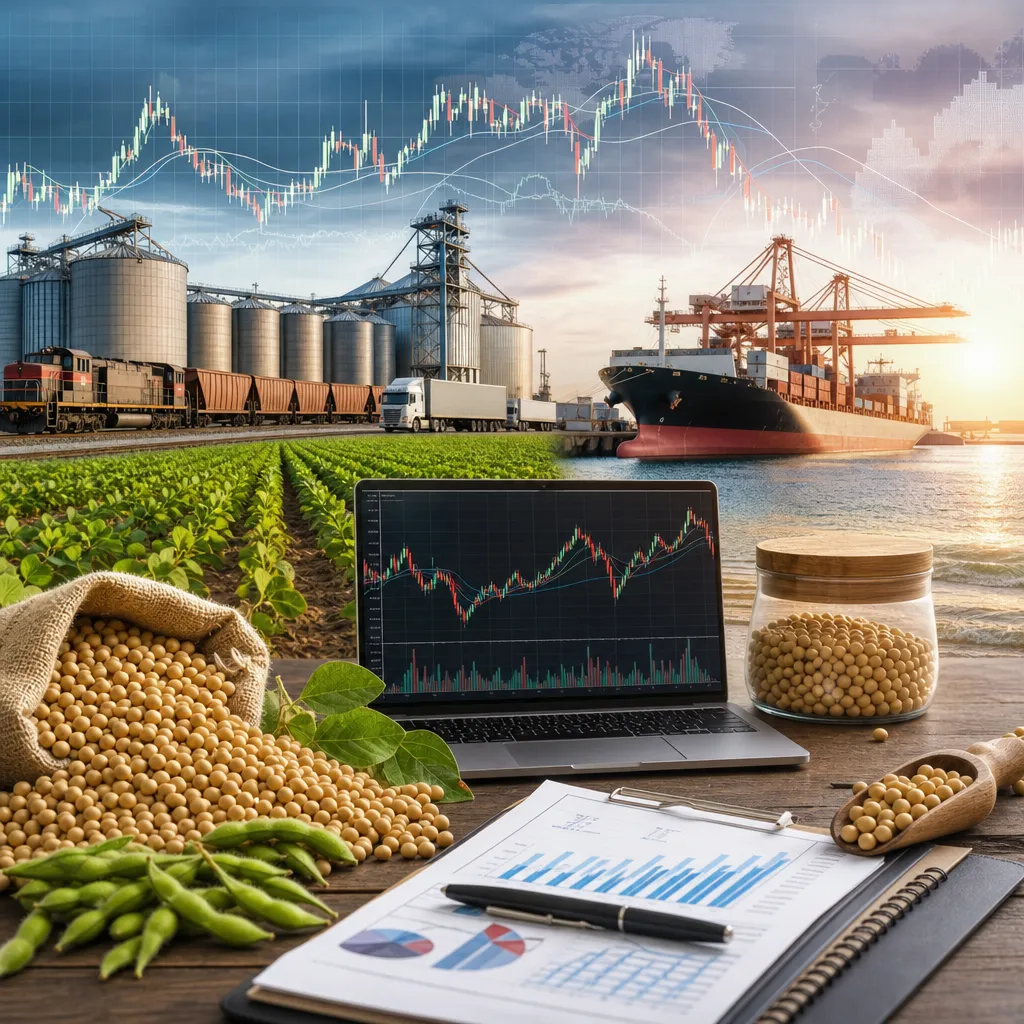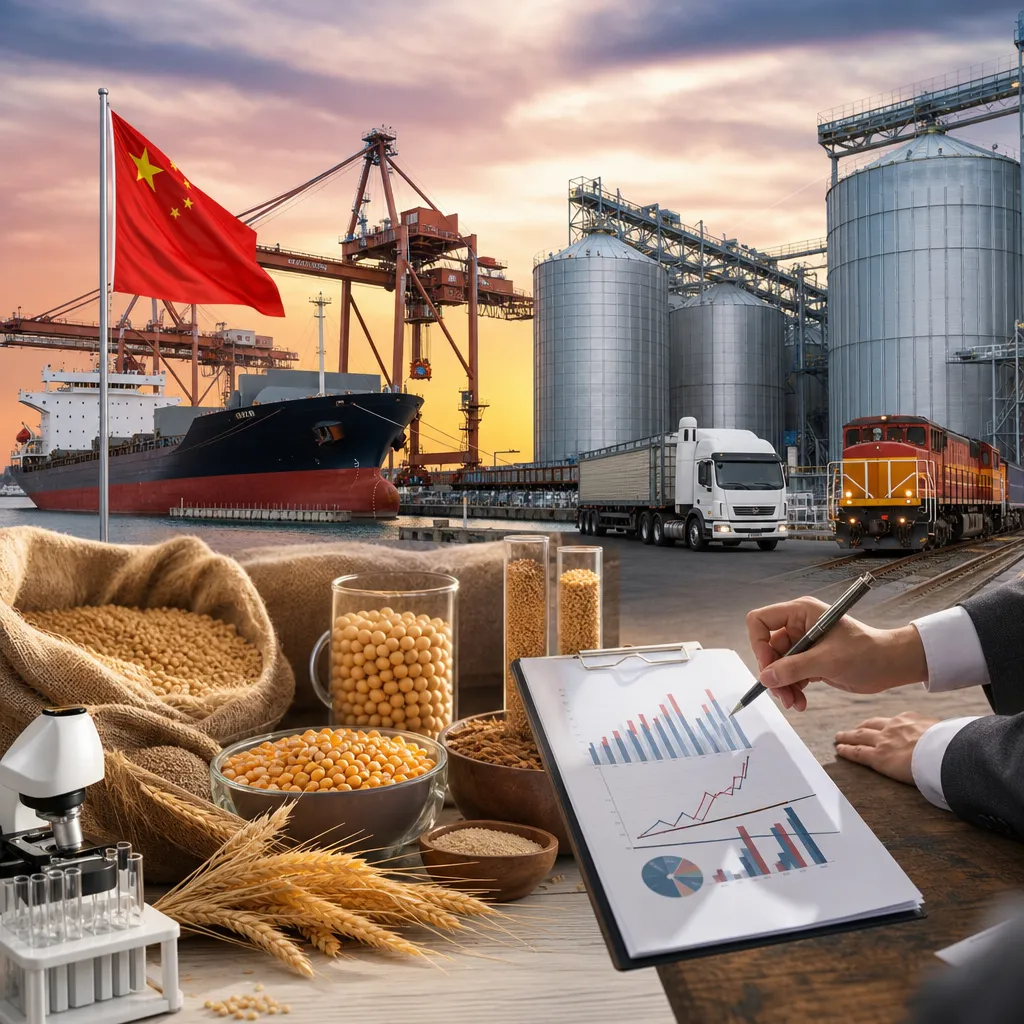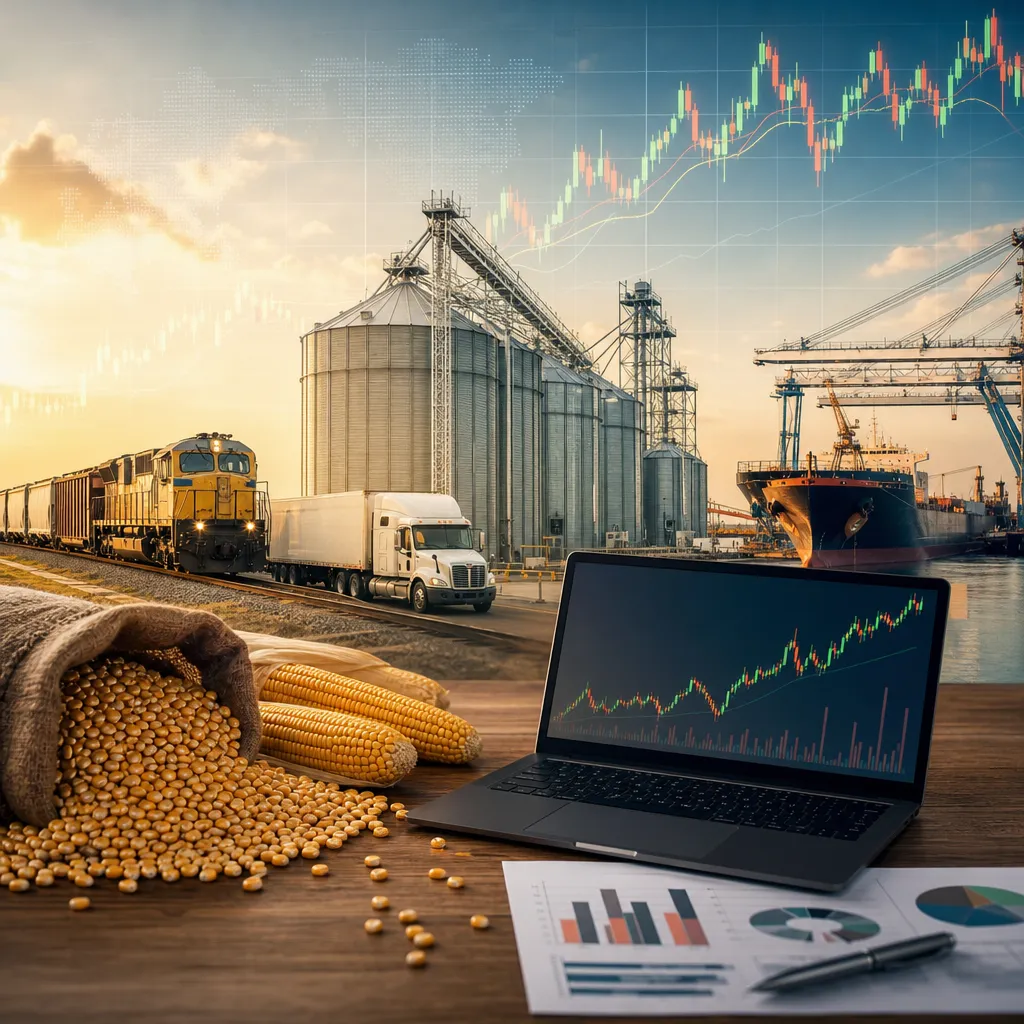


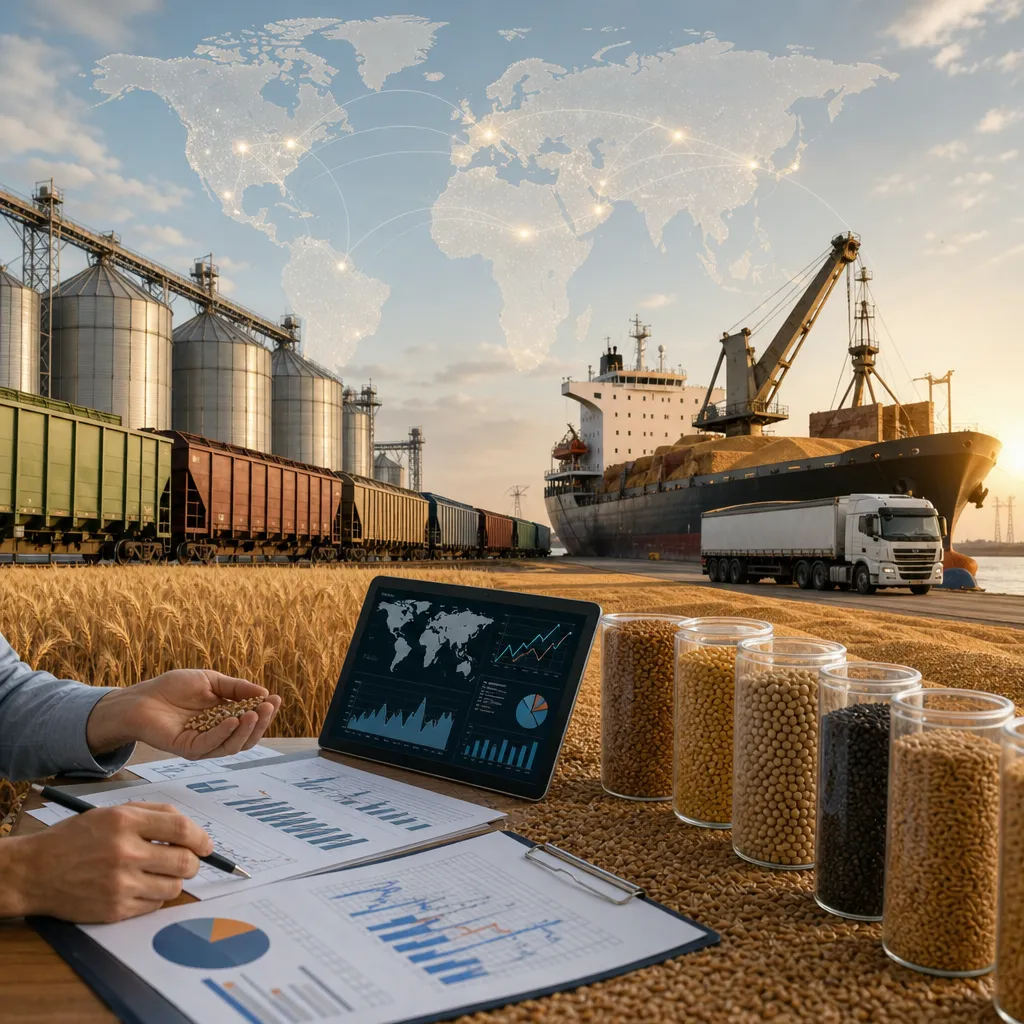
World grain stocks are the grain that remains in storage at the end of a marketing period, whether in farm bins, commercial elevators, processor facilities, government reserves, or export terminals. They matter because stocks act as the market’s buffer between one harvest and the next: when stocks are tight, prices usually become more sensitive to weather, logistics disruptions, and export demand; when stocks are comfortable, supply shocks are easier to absorb. In practice, analysts watch not just the absolute volume of stocks, but where they are held, which crop they cover, what quality they are, and how easily they can move into the market. For farmers, traders, millers, feed buyers, and importers, grain stocks are best understood as a physical supply reality first and a market signal second.
World grain stocks are not found in one warehouse or one database. They exist physically across many countries and supply chains, while the market learns about them through official balance sheets, surveys, trade flows, and private intelligence. The most widely used public reference points are crop balance reports from government and intergovernmental agencies, especially for wheat, corn, rice, barley, sorghum, soybeans, and oilseeds. A reader who wants to use grain stocks information effectively needs to know where the stocks are, how they are estimated, and how those estimates connect to futures, local cash markets, basis, freight, and storage decisions.
What world grain stocks mean in practice
In grain-market language, “stocks” usually means ending stocks or carryout. That is the amount expected to remain at the end of a marketing year after production, imports, and beginning inventories have been offset by exports, feed use, food use, seed use, industrial use, and losses.
This is usually expressed in a balance sheet:
Beginning stocks + production + imports = total supply
Total supply – domestic use – exports = ending stocks
That sounds simple, but the market impact depends on several practical details:
- Crop type: wheat stocks do not solve a corn shortage.
- Quality: feed wheat is not the same as milling wheat; spoiled grain is not equal to export-grade grain.
- Location: grain in an inland region with rail bottlenecks is less available than grain positioned near a port or processor.
- Ownership: stocks held by farmers, governments, exporters, or processors may not come to market at the same speed.
- Policy: export restrictions, reserve releases, or import policy can change the practical availability of stocks.
That is why traders often focus on stocks-to-use rather than stocks alone. Stocks-to-use compares ending stocks with expected consumption and gives a better sense of market tightness.
How grain stocks are estimated and where to find the data
No global authority physically counts every bushel or tonne in real time. World grain stocks are estimates built from production surveys, harvested area, yield estimates, on-farm and off-farm storage reports, consumption assumptions, export data, and revisions over time.
The main public sources readers normally use are:
- USDA WASDE: widely used global and country balance sheets for major grains and oilseeds. Analysts use it to compare production, use, exports, and ending stocks across countries.
- USDA Production and Grain Stocks reports: especially important for the United States, one of the largest market-moving origins.
- FAO: global food and cereal supply-demand monitoring with emphasis on broad international food balance conditions.
- National statistics agencies and agriculture ministries: important for domestic stock surveys, production revisions, and official inventory reporting in individual countries.
- Customs and export inspection data: used to test whether official stock assumptions match real movement.
- Commercial data services: merchants, brokers, processors, and funds often supplement official reports with satellite, vessel, rail, weather, and regional cash-flow data.
These data are mostly accessed online through official government or institutional websites, exchange data pages, and commercial market-information platforms. Public reports are commonly downloadable as PDF tables or spreadsheet-style balance sheets. Commercial services may package the same concepts into dashboards, APIs, charting systems, and alert tools, but they do not replace the underlying physical reality.
| Source type | What it provides | How market participants use it |
|---|---|---|
| USDA WASDE | Global and country supply-demand estimates, including ending stocks | Benchmark balance sheet analysis, market expectations, price reaction tracking |
| National crop and stocks reports | Domestic production and inventory estimates | Regional supply checks, basis and logistics planning |
| Customs and export data | Shipment and trade flow evidence | Testing whether export pace supports stock assumptions |
| Commercial analytics platforms | Integrated weather, freight, futures, basis, vessel, and balance-sheet tools | Fast risk management and trading decisions |
Why stocks move prices
Grain prices respond not only to current supply, but to the market’s confidence that enough grain will remain available later. Low ending stocks usually increase price volatility because any threat to the next crop matters more. A drought, flood, port outage, rail disruption, or sudden importer buying program can have a larger impact when the carryout cushion is thin.
High stocks can have the opposite effect. If wheat or corn stocks are burdensome, the market may need lower prices to stimulate feed demand, exports, or storage ownership. In that environment, rallies may struggle unless weather or policy creates a fresh threat.
The most important price relationships tied to stocks are:
- Nearby versus deferred futures: tight nearby supply can strengthen nearby contracts relative to later delivery months.
- Cash basis: local users may bid more aggressively if nearby physical supplies are hard to source.
- Spreads between crops: livestock feeders can switch formulations if one grain becomes too expensive relative to another.
- Export competitiveness: a country with larger available stocks may capture business if its offers are cheaper on a delivered basis.
However, not all global stocks are equally relevant to world price formation. The market often pays more attention to stocks held by major exporters than to stocks held by countries that rarely export or maintain tightly controlled domestic reserves.
World stocks versus local cash grain markets
A global stocks number is not the same thing as the price at a local elevator. Farmers and commercial grain sellers operate in a cash market shaped by basis, freight, quality, storage capacity, and local competition among buyers. World stocks influence that market, but they do not directly set the cash bid.
To understand where local value comes from, a seller usually looks at:
- Exchange futures: for example, wheat, corn, soybean, or canola futures where relevant.
- Local basis: the premium or discount applied by an elevator, processor, mill, ethanol plant, crush plant, feed mill, or export handler.
- Freight and destination: distance to river, rail terminal, processor, or port can materially change net price.
- Specifications: protein, test weight, moisture, falling number, dockage, damage, and mycotoxins can all affect value.
Local bids are normally checked through elevator and cooperative bid sheets, merchant bid systems, processor bids, and agricultural market reporting services. In some regions, bids are posted online by buyers; in others, they are quoted by phone, email, or through grain merchandisers. This is a physical transaction environment, not the same as looking at a futures screen.
| Market | What is traded or quoted | Where it is normally accessed | Main limitation |
|---|---|---|---|
| Futures market | Standardized exchange contracts | Regulated exchange data and broker trading platforms | Not the same as a local physical bid |
| Local cash market | Buyer bid for physical grain at a location and quality specification | Elevators, cooperatives, merchants, processors, feed mills | Varies by freight, basis, and quality |
| Export market | FOB or other shipment offers for vessel movement | Exporters, merchants, brokers, trade reporting, tender intelligence | May not reflect inland farm-gate value |
| OTC physical contracts | Negotiated forward, spot, or processor delivery contract | Direct buyer-seller negotiation or merchandiser | Counterparty and contract-term risk |
Where grain stocks physically exist
World grain stocks are spread across the supply chain. Some are still on farms after harvest. Some sit in inland silos and elevator systems waiting for rail or truck movement. Some are held by mills, crushers, maltsters, feed manufacturers, ethanol plants, and exporters. Some may be in strategic or state reserve systems.
The main physical locations are:
- On-farm storage: bins, silos, sheds, and bags where producers hold grain for later sale or logistical timing.
- Commercial elevators and cooperatives: aggregation points that receive, condition, store, blend, and ship grain.
- Processor storage: flour mills, feed mills, crushing plants, malting plants, starch plants, and biofuel facilities maintain working inventories.
- Port terminals: export houses position grain for vessel loading.
- Government reserve systems: in some countries, public agencies or state-linked entities hold food-security stocks.
Availability depends on whether the stock is merchantable. Grain in poor condition, tied up in finance, trapped by export controls, or too far from demand zones may exist statistically without being easy to buy.
How stocks affect hedging, futures, and options
World grain stocks are a core input for hedging decisions, but hedging takes place in financial markets that are separate from the physical movement of grain. Futures and options are generally traded on regulated exchanges through a futures broker. Physical grain is sold through merchants, elevators, processors, or direct contracts.
For grains, the most widely watched benchmark contracts are commonly listed on major commodity exchanges such as CME Group for several core agricultural futures. A trader or hedger needs a brokerage account approved for futures or options trading. This requires margin, meaning performance collateral, and carries leverage risk.
How stocks interact with hedging:
- Producer hedge: if large world stocks suggest downside price pressure, a farmer may forward sell cash grain or hedge with futures.
- Processor hedge: a flour mill or feed buyer may buy futures or calls if tightening stocks threaten higher raw-material costs.
- Merchant spread management: traders watch stocks to judge carry structure, inverse risk, and storage economics.
- Importer coverage: buyers in deficit countries may extend forward coverage if global stocks look vulnerable.
But stocks do not tell a trader exactly what the market will do next. Markets can rally even with large stocks if weather threatens the next crop, and they can fall even with tight stocks if demand weakens or macro conditions turn negative.
Options are often used when a participant wants price protection without fully locking in a fixed value. They still cost money in the form of premium, and their usefulness depends on time to expiration, volatility, and strike selection. They are not a substitute for understanding basis and local physical exposure.
How farmers, buyers, and traders use stocks in real decisions
For a farmer, grain stocks analysis is most useful when connected to specific selling choices:
- Check official balance-sheet reports for the crop in question.
- Compare current stocks ideas with local carry, basis, and storage space.
- Review nearby demand from elevators, mills, ethanol plants, feed mills, or exporters.
- Decide whether to sell spot, store, forward contract, or hedge.
- Re-check quality risk, shrink, aeration needs, and financing cost before storing.
For a physical buyer such as a mill, feed company, or processor:
- Track exporter and domestic stocks in relevant origins.
- Compare replacement cost across nearby and imported alternatives.
- Watch port lineups, rail performance, and vessel flow, not only futures prices.
- Secure quality specifications and delivery terms in purchase contracts.
- Assess counterparty performance and payment terms carefully.
For a speculative trader or analyst:
- Use stocks in combination with acreage, yield, weather, demand pace, and spreads.
- Compare official estimates with market expectations and revisions risk.
- Follow CFTC positioning and exchange spreads where relevant.
- Distinguish headline world stocks from exporter stocks and usable stocks.
Limits and common mistakes
The biggest mistake is treating world grain stocks as a precise, fully available inventory. Stocks are estimated, revised, and unevenly distributed. A large global total can hide local scarcity, poor quality, or state-controlled supply that does not reach export channels easily.
Other common errors include:
- Confusing futures with cash price: exchange price is a benchmark, not the exact local value received or paid.
- Ignoring basis: local shortages can strengthen basis even if futures are weak.
- Ignoring logistics: rail, barge, truck, and port congestion can make available stocks unusable in the short term.
- Ignoring quality: protein, moisture, damage, and contamination can sharply reduce commercial value.
- Looking only at absolute stocks: stocks-to-use and exporter stocks often matter more.
Storage decisions also have cost and risk. Holding grain means monitoring moisture, temperature, insects, spoilage, shrink, and financing cost. Commercial storage adds tariffs and handling charges. On-farm storage requires equipment, labor, power, and disciplined condition management.
FAQ
Where can I check world grain stocks online?
The most widely used public source is USDA’s World Agricultural Supply and Demand Estimates. FAO also provides global cereal market monitoring. For country-level detail, readers often use national agriculture ministries, statistical agencies, and official grain stocks reports where available.
Are world grain stocks the same as grain available for export?
No. Some stocks are held in countries that rarely export, some are tied up in domestic reserve systems, and some may be lower quality or poorly located. Exportable surplus depends on policy, logistics, quality, and domestic demand, not just headline stock totals.
How do world grain stocks affect local elevator bids?
They influence overall market tone and futures values, but local bids are also shaped by basis, freight, quality, nearby demand, and competition among buyers. A high world stocks number does not automatically mean a weak local bid, and a low stocks number does not guarantee a strong one.
Where does grain trading take place if I want to hedge stocks-related price risk?
Hedging with futures or options normally takes place through a regulated futures exchange accessed via a futures broker. Selling physical grain takes place separately through elevators, cooperatives, grain merchants, processors, feed companies, or export channels under cash contracts.
What is more important: total stocks or stocks-to-use?
Stocks-to-use is often more informative because it compares ending inventories with expected demand. A market with modest absolute stocks can still be comfortable if use is low, while a large stock number can be tight relative to very high consumption.
Can I buy physical grain directly based on world stocks analysis?
Yes, but the transaction is normally done through physical market participants such as merchants, elevators, cooperatives, processors, mills, feed companies, or brokers. You need to review grade, delivery point, freight, storage, inspection, payment terms, and counterparty risk. This is different from buying a futures contract.
Why do grain stock estimates change after publication?
They are revised as production surveys improve, trade data is updated, domestic use is reassessed, and inventory counts become clearer. Revisions can be significant, especially when weather damage, informal storage, or changing policy complicate measurement.
What should I watch together with stocks?
Watch acreage, yield prospects, weather, export pace, feed demand, biofuel demand, currency moves, fertilizer and energy costs, freight, and government policy. Stocks matter most when combined with these drivers, not in isolation.
Sources
- USDA World Agricultural Supply and Demand Estimates
- USDA National Agricultural Statistics Service Grain Stocks
- FAO Cereal Supply and Demand Brief