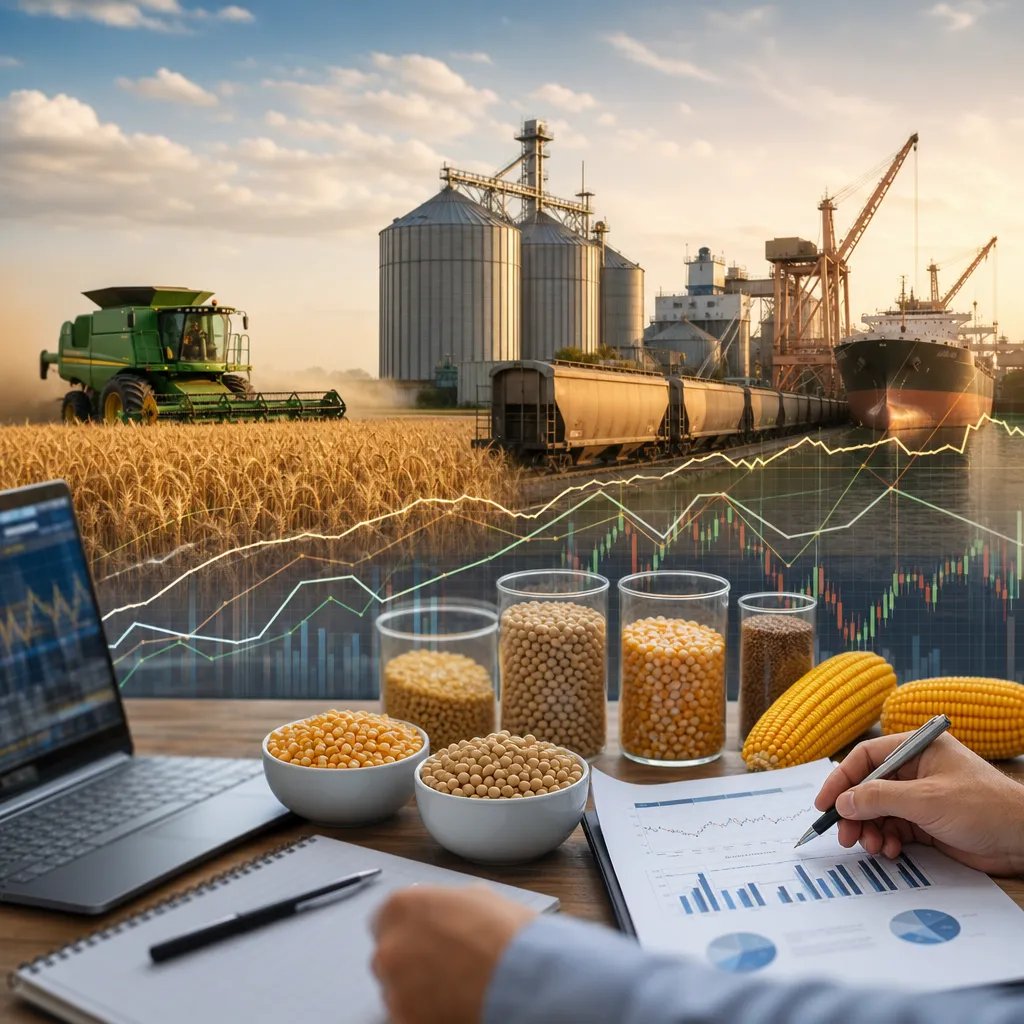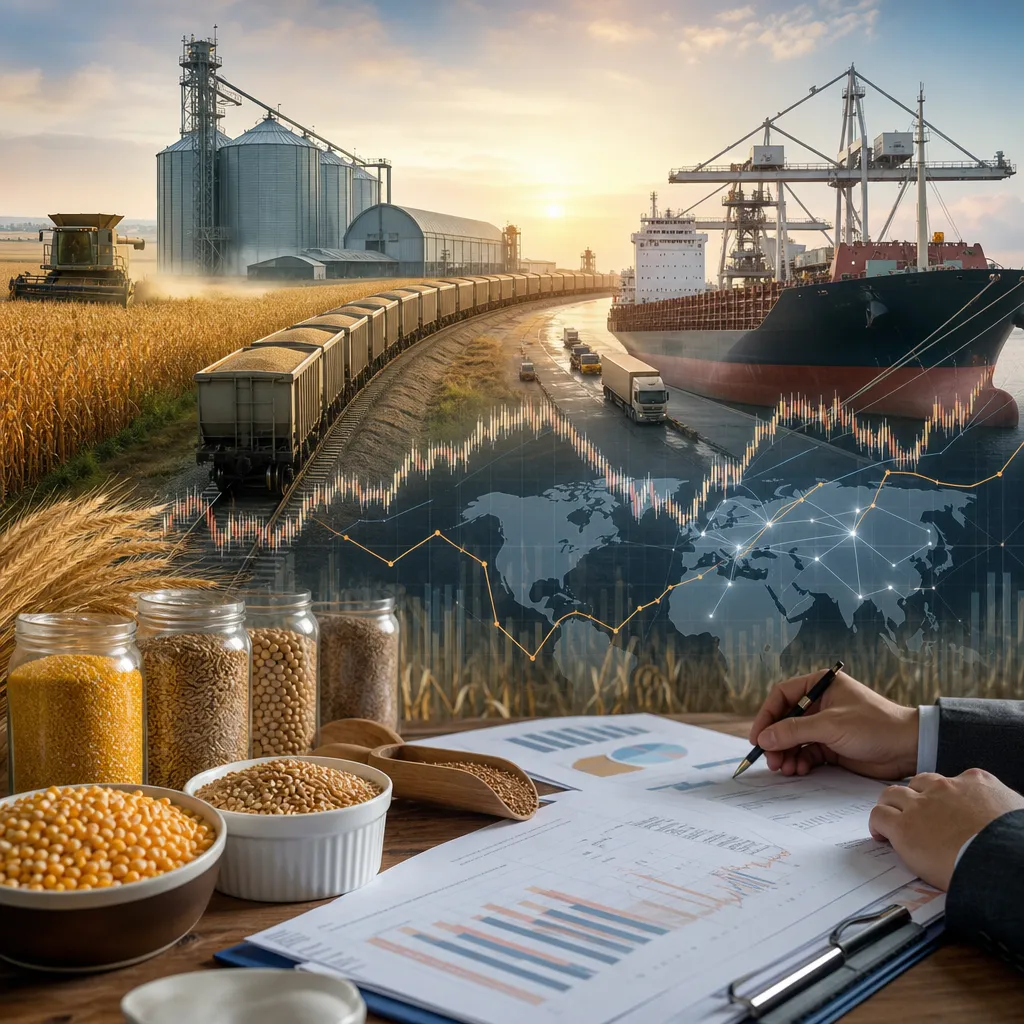





A grain market forecast is a structured view of how prices and trade flows may develop under different supply, demand, weather, and policy conditions. In practice, no serious forecast is a single number; it is a set of scenarios built from crop prospects, stocks, exports, currency moves, freight, and local basis. Readers should use forecasts differently depending on their role: farmers compare them with local cash bids and storage costs, processors compare them with coverage needs, and traders compare them with futures structure, spreads, and risk. The most reliable way to work with a grain forecast is to combine official reports, exchange prices, and local physical-market information rather than relying on headline predictions alone.
What a grain market forecast actually means
A grain market forecast is an estimate of future price direction and market balance for crops such as wheat, corn, soybeans, rice, barley, oats, rye, sorghum, canola, rapeseed, and sunflower seed. It may refer to global benchmark prices, exchange-traded futures, regional export values, or local cash bids paid by elevators and processors.
The first practical distinction is between futures prices and physical cash prices. Futures are standardized contracts traded on regulated exchanges such as CME Group. Local cash prices are the prices actually offered in the physical market by grain elevators, cooperatives, merchants, feed mills, crushers, ethanol plants, flour mills, or exporters. A forecast for Chicago corn futures is not automatically a forecast for the exact farmgate price in a specific county, because local basis, freight, quality, and handling costs matter.
For this reason, useful grain forecasting usually works on two levels:
- Benchmark market outlook: futures, export values, and world balance sheets.
- Local cash outlook: basis, transport demand, storage pressure, nearby processor demand, and regional quality conditions.
How grain prices are formed in real markets
Grain prices are created through interaction between the paper market and the physical market. The paper market gives transparent benchmark pricing, while the physical market reflects actual delivery needs, quality, and logistics.
| Market type | Where it exists | What price means | Who uses it |
|---|---|---|---|
| Futures market | Regulated exchanges such as CME Group | Standardized contract price for future delivery month | Hedgers, speculators, merchandisers, processors, funds |
| Cash market | Elevators, cooperatives, mills, crushers, feed buyers, exporters | Actual physical bid or offer at a location for a defined quality | Farmers, merchants, processors, livestock feeders |
| Forward contract market | Direct contracts with merchants, elevators, processors, exporters | Agreed physical delivery price or basis for future shipment | Farmers, commercial hedgers, buyers |
| Options market | Exchange-traded through futures brokers | Price of the right, not obligation, to buy or sell futures | Hedgers seeking protection, traders managing defined risk |
In practice, many local cash prices are quoted as futures plus or minus basis. Basis is the difference between the local cash bid and the relevant futures month. Basis reflects local supply and demand, distance to end users or export channels, freight cost, storage conditions, and grain quality.
That is why two regions can face the same futures market but very different local price forecasts. A drought area may have stronger basis because grain is scarce locally. A harvest-surplus area may have weaker basis if elevators are full and transport is tight.
Main drivers of a grain market forecast
Most grain forecasts are built from a relatively stable framework. The challenge is not identifying the drivers, but estimating how they interact and which one the market has not fully priced yet.
| Driver | Typical effect on grain markets | How readers normally check it |
|---|---|---|
| Acreage | More planted area can increase supply expectations; fewer acres can tighten outlook | USDA acreage reports, national crop surveys, ministry statistics |
| Yield and weather | Improving yields often pressure prices; weather stress can support them | Weather services, crop condition reports, satellite-based crop monitoring |
| Stocks and stocks-to-use | Low carryout usually increases sensitivity to shocks | USDA WASDE, official stock reports, balance-sheet analysis |
| Exports and imports | Stronger exports tighten domestic availability; heavier imports can cap prices | Export sales reports, customs data, port lineups, trade statistics |
| Currency moves | A weaker exporting-country currency can improve export competitiveness | FX markets, central bank data, commercial market terminals |
| Energy and biofuels | Higher fuel and biofuel demand can support corn, soybeans, canola, rapeseed | Energy market data, biofuel policy updates, processor margins |
| Freight and logistics | Transport disruption can weaken farmgate bids even if futures are firm | Local cash bids, railway and barge conditions, port activity, merchant quotes |
Different crops emphasize different drivers. Wheat often reacts strongly to Black Sea weather, export policy, and protein quality. Corn is heavily affected by yield potential, feed use, and ethanol demand. Soybeans depend on crop size, crushing margins, export demand, and vegetable-oil markets. Rice can be more policy-sensitive, especially when governments adjust export restrictions or food-security measures.
Where to find grain forecast inputs and market data
Reliable forecasting starts with reliable data. The most widely used public sources are official agricultural agencies and regulated exchanges.
USDA is one of the main global reference points. Its most-watched publications include:
- WASDE for world and U.S. supply-demand balance sheets.
- Crop Progress for planting pace, crop condition, and harvest progress.
- Export Sales for weekly export commitments and shipments.
- Grain Stocks for inventory checkpoints.
- NASS reports for acreage, production, and yield surveys.
CME Group provides futures and options market information for benchmark contracts including corn, wheat, soybeans, soybean meal, soybean oil, oats, rough rice, and canola-related reference markets through linked products or market coverage depending on jurisdiction. Exchange data helps readers track price direction, volume, open interest, and contract structure, but not local cash bids.
CFTC publishes Commitments of Traders reports. These do not forecast crop size, but they help readers understand how commercial hedgers, managed money, and other participants are positioned in futures and options markets.
FAO is useful for global food and agricultural context, especially when comparing broad trends in cereals, oils, and food security conditions.
For local cash markets, readers usually need to check:
- grain elevator bid sheets, often posted online or through mobile apps,
- cooperative bid pages,
- merchant and processor bids,
- government or regional agricultural market reporting services where available,
- direct bids from mills, crushers, feed manufacturers, or exporters.
This local information is essential because a formal outlook may call for stronger grain prices while nearby cash bids remain weak due to harvest pressure, poor basis, or full storage capacity.
How professionals build a grain forecast in practice
An expert forecast usually begins with a balance-sheet view and then adjusts for timing, logistics, and market behavior.
- Define the market: decide whether the forecast concerns futures, export values, or local cash grain in a specific region.
- Choose the crop year and delivery period: old-crop and new-crop markets often trade differently.
- Build supply scenarios: planted area, harvested area, trend yield, favorable weather, and adverse weather cases.
- Build demand scenarios: feed use, export pace, crush or milling demand, industrial use, imports, and substitution between grains.
- Check ending stocks: lower carryout generally increases volatility and market sensitivity.
- Review market structure: nearby futures versus deferred futures, and whether the market rewards storage or discourages it.
- Overlay local basis: estimate whether basis may strengthen or weaken with harvest, barge availability, rail constraints, or processor demand.
- Test policy and currency shocks: tariffs, export restrictions, subsidy changes, or FX volatility can change trade flows quickly.
Professionals rarely rely on one report date. They follow how the market reacts to new information. If bullish numbers fail to lift prices, it may indicate the market was already positioned for them. If a small weather change creates a large rally, that often means the market is running with little margin for error.
Forecast scenarios for key grains
The most useful forecast format is scenario-based.
Wheat
A constructive wheat outlook usually requires some combination of weather risk, downgraded yields, quality problems, stronger demand, or tighter exportable supplies from major exporters. A weaker outlook can develop when major producers harvest larger crops, feed wheat demand softens, or aggressive exporter competition pressures world values. In physical trade, wheat quality matters greatly: protein, test weight, falling numbers, moisture, and damage can create a large gap between benchmark prices and actual marketability.
Corn
Corn forecasts tend to focus on acreage, yield potential, feed demand, export competitiveness, and ethanol use. During the growing season, weather can dominate. After harvest, storage pressure and export pace become more important. In local markets, an ethanol plant or feed mill can support basis even when futures are weak.
Soybeans and oilseeds
Soybean, canola, rapeseed, and sunflower seed forecasts depend not only on seed supply but also on processing economics. Crushing demand links these markets to meal demand for livestock feed and oil demand for food and biofuels. This means oilseed forecasts often move with energy markets and vegetable-oil trade, not just with field yields.
Rice and other feed grains
Rice often responds more sharply to government policy, domestic food programs, export controls, and currency changes. Barley, sorghum, rye, and oats can trade with weaker transparency than corn or wheat in some regions, so local demand from feed users, maltsters, or niche food buyers can matter more than headline futures moves.
Where forecasts are used: farming, trading, procurement, and storage
A forecast is only useful if it improves an actual decision.
Farmers use forecasts to decide whether to sell spot, forward contract, store grain, hedge with futures, or buy options as price protection. The decision usually depends on local basis, on-farm storage capacity, financing cost, shrink risk, and whether grain quality can be preserved.
Processors and feed buyers use forecasts to plan coverage. They may buy physical grain from elevators or merchants, negotiate direct contracts with producers, or hedge raw material exposure through futures while arranging physical supply separately.
Exporters and merchants use forecasts to manage origin buying, freight commitments, and destination sales. Their trade is often a combination of physical contract management and futures hedging.
Financial traders use exchange-listed futures and options through a regulated broker account. This is distinct from buying truckloads of grain. Online futures trading gives price exposure, not ownership of usable physical grain for feed or milling unless a participant is equipped for delivery procedures and contract settlement obligations.
Futures, options, and hedging in a grain forecast
Grain futures and options are often the most visible forecast expression, but they should be used carefully.
A futures contract is a standardized exchange-traded agreement linked to a specific commodity, quantity, and delivery month. It is accessed through a registered futures broker, not through a local grain elevator. Trading requires a margin account, and leverage magnifies gains and losses.
Options give the right, but not the obligation, to buy or sell a futures contract at a set strike price. They are commonly used by hedgers who want protection against adverse price moves while keeping some upside potential. The trade-off is the option premium.
For hedging, the key forecast question is not just “Will prices rise or fall?” but “What part of my risk comes from futures and what part comes from basis?” A crusher may hedge futures and still face basis risk. A farmer may lock a basis contract and remain exposed to futures until priced. A forecast that ignores basis risk is incomplete.
Readers should also remember that expiry and delivery matter. Many financial traders close or roll positions before delivery. Commercial users may maintain hedges against actual physical ownership or forward commitments.
Limits, risks, and common forecasting mistakes
The grain market is highly forecastable in structure but not perfectly predictable in timing. Agriculture is exposed to weather, policy, logistics, and geopolitical changes that can alter supply or trade suddenly.
Common mistakes include:
- Using only futures quotes and ignoring local basis.
- Assuming global surplus means weak local cash prices, even when nearby demand is strong.
- Ignoring quality, especially in wheat, malting barley, rice, and specialty grains.
- Confusing storage with value creation; carrying grain only works if expected price improvement exceeds storage, interest, shrink, and quality risks.
- Using a single report as certainty instead of updating scenarios as new data arrives.
- Overusing leverage in futures or options strategies without a clear commercial or risk-management purpose.
A practical forecast should therefore answer three separate questions: what benchmark prices may do, what local cash bids may do, and what action is justified after costs and risks are considered.
Where can I check grain prices today?
Benchmark futures prices are normally checked on exchange websites such as CME Group or through broker and market-data platforms. Local cash grain prices are usually checked through elevator bids, cooperative bid pages, processor bid sheets, merchant quotes, or official regional market reporting services where available. Futures prices and local bids are not the same thing.
How do I use a grain market forecast if I sell physical grain?
Start with the forecast for the relevant crop and delivery period, then compare it with actual local bids for your grade and location. Check basis, freight, storage cost, moisture or quality discounts, and payment terms before deciding whether to sell spot, store, or forward contract.
Where does physical grain trading actually take place?
Most physical grain trading takes place through elevators, cooperatives, grain merchants, processors, mills, crushers, feed manufacturers, exporters, and direct producer contracts. Transactions are negotiated around location, quality, quantity, delivery window, basis, freight responsibility, and payment terms.
Can I trade grain online without buying physical grain?
Yes. Futures and options can be traded online through a regulated futures broker, which gives financial exposure to grain prices. That is different from owning grain in a warehouse or delivering to an elevator. Physical grain deals usually require a commercial relationship with a buyer or merchant, not just a trading account.
What reports matter most for grain forecasting?
USDA WASDE, Crop Progress, Export Sales, Grain Stocks, and acreage or production reports are core references for many analysts. CFTC positioning data is helpful for reading market sentiment and fund exposure. Local market participants also watch regional crop reports, port activity, and processor demand.
Why can my local cash bid fall even if futures rise?
Because local basis may weaken. Common reasons include harvest pressure, full elevator space, transport bottlenecks, weak nearby processor demand, or quality concerns. Futures and cash prices move together over time, but not perfectly day to day.
How should storage be included in a grain forecast?
Storage should be treated as an economic decision, not just a delay in selling. Compare expected future cash price with storage fees, financing cost, shrink, aeration, spoilage risk, and potential quality discounts. If basis is likely to improve later, storage may add value, but that is not guaranteed.
What is the safest way to interpret a grain market forecast?
Use scenarios instead of certainty. Build a plan for bullish, neutral, and bearish outcomes, and update it as weather, reports, and local bids change. The most practical forecast is one linked to actual merchandising or risk-management decisions, not just a market opinion.
Sources
- USDA World Agricultural Supply and Demand Estimates
- CME Group Agricultural Products
- U.S. Commodity Futures Trading Commission Commitments of Traders