
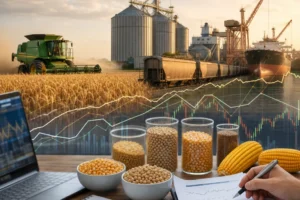


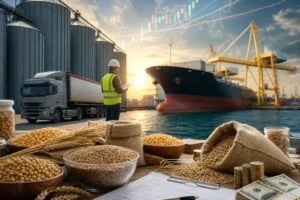


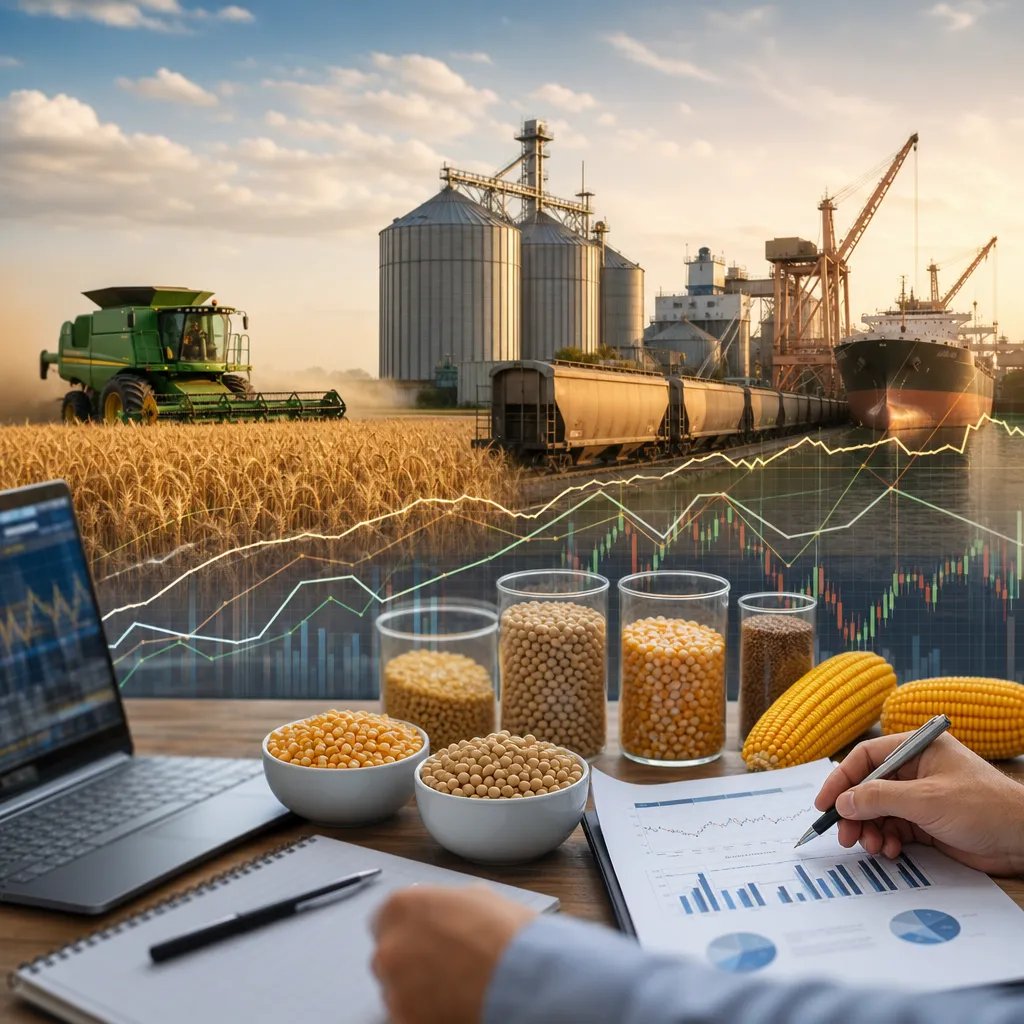
The United States grain market is not a single price point but a network of futures exchanges, river terminals, export elevators, rail markets, feed mills, ethanol plants, crushers, and country elevators spread across major crop-producing regions. When people discuss US grain price trends, they usually mean trends in corn, soybeans, wheat, and sometimes sorghum, viewed through both exchange-traded futures and local cash prices. The market operates nationally, but prices differ sharply by location because transport, storage, quality, basis, and export demand all matter. To understand price trends in the US, readers need to separate benchmark futures from the physical cash market and then see how both connect through basis and logistics.
In practice, US grain pricing is centered on globally watched futures markets such as Chicago corn, soybeans, and wheat, but actual grain is bought and sold every day in local and regional cash markets. A farmer in Iowa, a feed mill in North Carolina, and an exporter on the Gulf Coast may all be trading the same crop, yet not at the same price. That is why any serious reading of US grain price trends must start with geography, contract type, delivery point, and pricing unit.
What “US grain price trends” means
In the US context, grain price trends usually refer to directional changes in the values of major crops over time, especially corn, soybeans, and wheat. Depending on the audience, the reference price may be a futures contract listed on a US exchange, a local elevator cash bid, a processor bid, or an export bid at a major shipping point.
The US is one of the world’s most important grain and oilseed producers and exporters. Corn and soybeans dominate much of the Midwest, while wheat production is spread across several regions, including the Plains and Northern states. Because the country is both a major producer and a major exporter, domestic prices are highly sensitive to global supply and demand, weather, river conditions, freight, currency moves, and policy changes.
Prices are commonly discussed in US dollars. Futures are usually quoted in cents per bushel or dollars per bushel, while export and some commercial markets may also use dollars per metric ton or dollars per short ton, depending on the trade flow and reporting convention.
Where the market operates in the United States
The US grain market is national, but it functions through distinct regional hubs. The Corn Belt is central for corn and soybean production and country elevator activity. The Plains are critical for wheat. River systems, especially the Mississippi and related waterways, connect inland supply to export channels. Major export pricing points often include the US Gulf, while Pacific Northwest routes matter for some wheat and other flows to Asia.
Physical grain changes hands across several layers of the market:
- Country elevators and cooperatives buying from farmers
- Rail and barge terminals aggregating grain
- Processors such as ethanol plants, soybean crushers, flour mills, and feed manufacturers
- Exporters buying for shipment through port terminals
- Livestock and poultry sectors purchasing feed grain
The best-known financial benchmark for US grain pricing is the futures market run by CME Group, particularly contracts associated with the Chicago Board of Trade tradition. However, futures are only the benchmark layer. The local cash market is where physical delivery terms, quality, and freight costs become decisive.
How US grain prices are formed
US grain prices are formed through an interaction between benchmark futures and local cash basis. Futures provide a transparent reference price for broad market value and expectations. Basis reflects the local adjustment needed to turn that benchmark into a real-world nearby buying or selling price.
In simple terms:
- Futures price: the exchange-traded benchmark for a specific contract month
- Cash bid: the local physical buying price offered by an elevator, processor, or merchant
- Basis: the difference between the local cash price and the relevant futures contract
- Delivered price: price including agreed transport to a destination such as a mill or processor
- FOB price: price quoted free on board at an export point, before ocean freight
- CIF price: price including cost, insurance, and freight to the import destination
A strong local basis often means buyers need grain and are willing to bid up relative to futures. A weak basis often suggests burdensome local supply, expensive freight, slow demand, or storage pressure. This is why a futures rally does not always translate one-for-one into stronger local farm bids.
| Price type | Where quoted | What it means |
|---|---|---|
| Futures price | CME Group futures market | Benchmark forward value for a standardized contract month |
| Local cash bid | Elevator, cooperative, processor, feed mill | Nearby physical buying price at a specific location |
| Basis | Local merchandiser quotes, bid sheets | Difference between local cash price and futures benchmark |
| Delivered price | Processor or destination contract | Price for grain delivered to a named facility |
| FOB export price | Export market reporting | Value of grain loaded or quoted at the export point before sea freight |
| CIF import price | Import trade tenders or destination offers | Landed value including freight and insurance to buyer destination |
Main drivers of US grain price trends
US grain prices move because the market constantly updates supply-and-demand expectations. The most important drivers often change by season. Before planting, acreage expectations matter. During the growing season, weather and crop conditions become dominant. At harvest, yields, farmer selling pace, and storage capacity become more important. Later in the marketing year, exports, feed use, processing demand, and ending stock expectations can drive price direction.
Key factors include:
- Weather: drought, excessive rain, heat, frost, and storm damage
- Acreage and yield expectations: especially for corn, soybeans, and wheat
- USDA reports: crop progress, acreage, production, stocks, export sales
- Export demand: competitiveness of US grain versus South America, the Black Sea, or other exporters
- Domestic processing demand: ethanol, soybean crush, flour milling, feed demand
- River, rail, and port logistics: freight disruptions can weaken or strengthen regional basis
- Energy and input costs: fuel and fertilizer affect producer economics and downstream demand
- Currency trends: a stronger US dollar can reduce export competitiveness
- Government policy: biofuel mandates, trade measures, and regulatory changes
For trend analysis, it is useful to distinguish between a futures-driven move and a basis-driven move. Futures often react first to national or global news. Basis often reacts to local logistics, processor margins, and physical grain availability.
| Factor | Typical effect on prices | Why it matters |
|---|---|---|
| Adverse growing weather | Often supportive | Raises concern about production and yields |
| Large harvest | Often pressure on cash and basis | Increases nearby physical supply |
| Strong export program | Supportive for futures and export basis | Moves grain out of the domestic balance sheet |
| Weak river or rail logistics | Can weaken inland bids, sometimes support destination markets | Disrupts movement from farm to processor or port |
| High processor demand | Strengthens local basis near plants | Buyers compete for nearby supplies |
| Stronger US dollar | Can be bearish for exports | US grain becomes less competitive in world trade |
Where to check US grain prices and market information online
Readers looking for current US grain prices should first decide whether they need a futures quote or a local physical bid. These are not the same thing, and using one as a substitute for the other can be misleading.
For benchmark futures and contract information, the most relevant official source is CME Group. This is where market participants check listed grain contracts, contract months, and official market structure. Futures data may also be available through brokerage platforms, financial terminals, and market data vendors.
For official supply-and-demand reporting, crop conditions, stocks, and export-related information, the most widely used institutional source is the US Department of Agriculture (USDA). Within USDA, market participants commonly follow reports from the World Agricultural Outlook Board, National Agricultural Statistics Service, Foreign Agricultural Service, and Agricultural Marketing Service.
For local cash prices, basis, and spot bids, farmers and commercial users usually check:
- Local elevator and cooperative bid sheets
- Processor bids from ethanol plants, soybean crushers, flour mills, or feed mills
- Merchant or grain company procurement quotes
- Regional market reports where available
- Brokerage or farm marketing platforms that aggregate local bids
Cash prices differ from futures because they reflect location, handling costs, freight, storage, quality terms, and immediate buyer demand. A strong Gulf export market may support terminal bids while a remote surplus county still shows a weak farm bid because moving grain is expensive.
How grain is actually bought and sold in the physical US market
Physical grain trading in the US usually begins with a farmer or grain owner selling to a local buyer. That buyer may be a cooperative, country elevator, processor, feed manufacturer, mill, or exporter. Grain is bought under contracts that specify quantity, quality, delivery period, delivery point, and payment terms.
Common commercial arrangements include:
- Spot or cash sale: immediate or nearby delivery at the current cash bid
- Forward cash contract: agreement today for delivery later at a fixed cash price
- Basis contract: basis is fixed now, futures price is fixed later
- Hedge-to-arrive type structure: futures component fixed, basis set later, where offered and understood
- Delivered contract: seller arranges transport to the named destination
- Storage arrangements: grain held at elevator or on farm pending later sale
Buyers may apply discounts or premiums based on moisture, test weight, foreign material, protein, or other crop-specific quality factors. Payment timing, title transfer, and shrink or drying charges may also affect the seller’s realized price.
The physical market is relationship-based and location-specific. Online tools may help compare bids, but the grain itself still moves by truck, rail, or barge to a physical buyer. Owning a futures contract does not mean owning warehouse grain, and selling cash grain does not automatically hedge price risk unless a separate futures or options strategy is used.
How futures and options are used in the United States
Futures and options are used for price risk management and also by financial traders seeking price exposure. These markets operate through regulated brokerage accounts, not through country elevators unless a commercial program specifically incorporates futures-based pricing.
Typical users include:
- Farmers hedging unsold production
- Elevators hedging inventory and forward purchases
- Processors hedging input costs
- Exporters managing price exposure on sales programs
- Speculators and funds trading market direction or spreads
A futures hedge can reduce exposure to broad market moves, but it does not remove basis risk. A producer who sells futures may still face a weakening local basis. Likewise, a processor buying futures to protect coverage may still face local supply shortages.
Options are often used when a participant wants protection with more flexibility than a straight futures hedge, though they involve premium cost and still require a good understanding of timing and basis.
Access normally requires a broker, account approval, and margin for futures. Because leverage can magnify losses as well as gains, futures and options should not be confused with simple physical grain selling.
US export and import pricing channels
The United States is a major grain exporter, so export market trends often influence domestic values. Export prices are commonly discussed in FOB terms at major shipment regions. Inland grain values are linked to these export channels through barge, rail, and terminal demand.
When export demand is strong, bids at river terminals and port positions may improve, which can support upstream basis in supplying regions. When export demand is weak or freight is disrupted, inland prices may disconnect and soften even if futures remain relatively firm.
The US also imports some grain or grain products in specific situations, though the broader market role is mainly that of a large exporter. Import pricing where relevant tends to use delivered or CIF logic rather than local farm-gate benchmarks.
Merchants, exporters, terminal operators, freight providers, and import buyers all take part in this chain. Physical export business is usually done through commercial contracts, not through the retail brokerage system used for futures speculation.
How to read US grain trends in practice
A practical approach is to track three layers at once: benchmark futures, local basis, and official supply-and-demand reporting. Looking at only one layer can lead to wrong conclusions. For example, futures may fall on a large crop outlook while local basis strengthens because nearby supplies around a processor are tight.
Useful habits include:
- Identify the commodity and crop year
- Check which futures contract month the market is discussing
- Check the local cash bid and basis at the intended delivery point
- Watch USDA reports for acreage, yield, stocks, and export sales
- Monitor regional logistics such as river levels, rail service, and harvest pressure
- Separate national trend headlines from your actual local market
Forecasting should always be scenario-based. A supportive trend can develop if weather threatens yield, export demand improves, or stocks tighten. A bearish trend can emerge if acreage expands, yields surprise higher, or world competitors undercut US export offers. In many periods, futures direction and local basis tell slightly different stories, and the actual cash outcome depends on both.
FAQ
Where can I check current US grain prices?
For benchmark futures, check CME Group and broker market data platforms. For real local buying prices, check country elevators, cooperatives, processors, or merchant bid sheets in your area. A futures quote is not the same as a farm cash bid.
What is the main benchmark for US grain prices?
For many participants, the main benchmark is CBOT-linked grain futures within CME Group, especially for corn, soybeans, and wheat. Local cash markets then adjust that benchmark through basis.
Why is my local corn or soybean bid different from the futures market?
Because local bids include basis, which reflects freight, storage, buyer demand, local supply, quality terms, and logistics. A nearby processor may bid more aggressively than a distant elevator even on the same day.
How is grain physically sold in the United States?
Usually through elevators, cooperatives, processors, mills, feed companies, or exporters under cash, forward, basis, or delivered contracts. Terms typically cover quantity, grade or quality, delivery window, destination, and payment.
Can I trade US grain prices online without buying physical grain?
Yes. Futures and options can be traded through a licensed broker or trading platform offering exchange access. That gives financial exposure to price changes, but it is different from owning or delivering physical grain.
Are US export prices the same as inland farm prices?
No. Export prices often reflect FOB terms at a port or export loading region, while farm prices are local cash bids inland. The difference includes basis, handling, elevation, and transport costs.
What units are commonly used in the US grain market?
Futures are commonly quoted in cents or dollars per bushel. Some commercial and export transactions may be discussed in dollars per metric ton or short ton, depending on the trade context.
What reports matter most for US grain price trends?
USDA crop progress, acreage, production, stocks, and export sales reports are among the most followed. Traders also watch weather, energy markets, biofuel demand, and transport conditions.
Sources
- US Department of Agriculture
- CME Group
- USDA Agricultural Marketing Service