



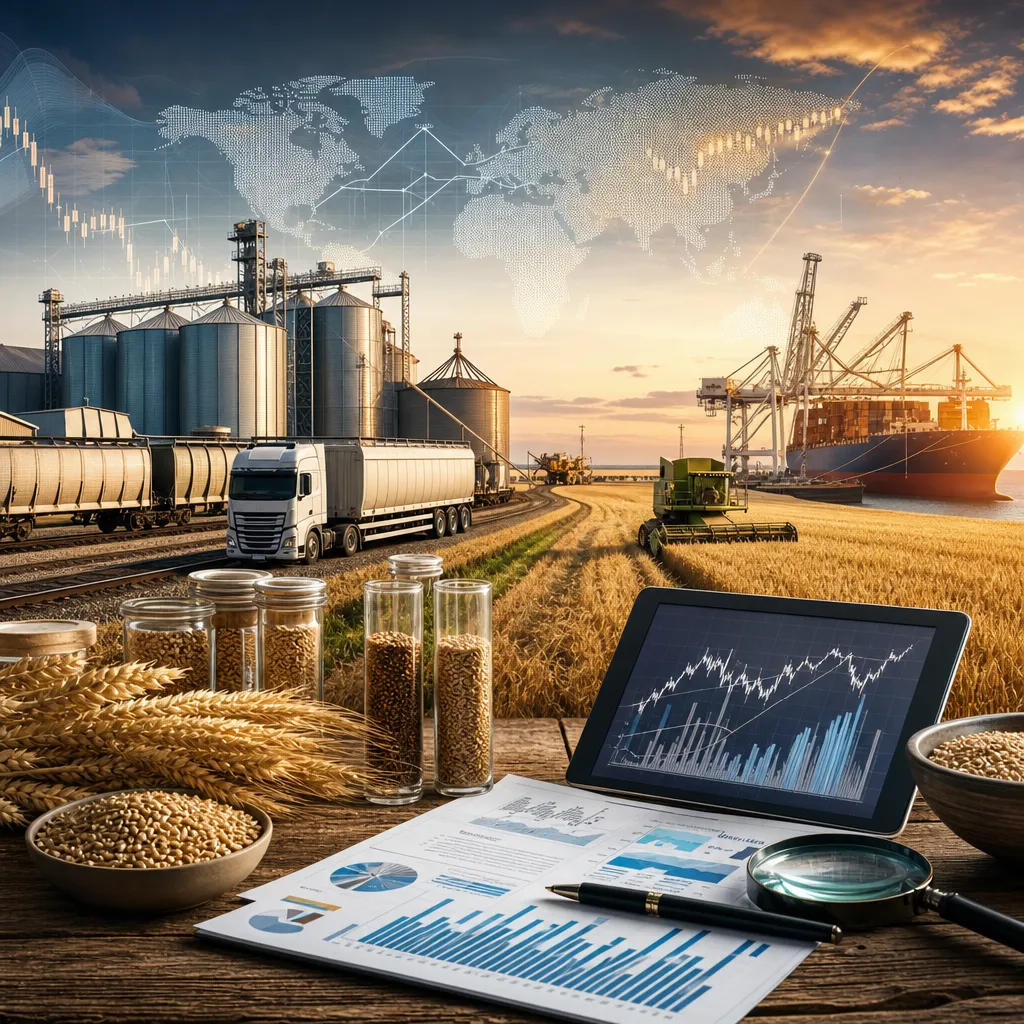
The United States wheat market is one of the world’s most important grain systems, linking farm production across the Plains, Midwest, Pacific Northwest, and Northern states to domestic mills, feed users, and export buyers around the world. “US wheat supply and demand” refers to the balance between how much wheat the country produces, imports, stores, consumes, and exports in a given marketing year. That balance matters because it shapes futures prices, local cash bids, export competitiveness, and hedging decisions for farmers, merchants, millers, and traders. In practice, the US wheat market is not one single price or one single location: it is a network of regional physical markets tied to national and global benchmarks.
US wheat is usually discussed in US dollars. Futures are commonly quoted in cents per bushel, while export and many international trade values are often discussed in dollars per metric ton. Physical grain in country markets is typically bought and sold through local cash bids that reflect a futures benchmark plus or minus a local basis.
What “US wheat supply and demand” means
In market terms, supply and demand is a balance sheet. On the supply side, the US market looks at beginning stocks, current crop production, and imports. On the demand side, it tracks food use, seed use, feed and residual use, exports, and ending stocks. Traders, grain companies, and processors watch this balance because even small changes in stocks, export pace, or crop size can shift market expectations.
The US produces several wheat classes, not one uniform crop. The main classes include Hard Red Winter, Soft Red Winter, Hard Red Spring, White wheat, and Durum. These classes serve different end uses such as bread flour, pastries, noodles, and pasta, so supply and demand conditions can differ by class as well as by the national total.
This matters because the national wheat balance sheet may appear comfortable while one class remains tight. For example, milling quality, protein levels, or regional production issues can support one market even when total US wheat stocks are not especially low.
Where the US wheat market operates
The US wheat market operates across several connected geographies.
- Production regions: Winter wheat is concentrated in the central and southern Plains, including Kansas, Oklahoma, and Texas. Spring wheat is centered in the Northern Plains, especially North Dakota, Montana, and Minnesota. White wheat is important in the Pacific Northwest. Durum is heavily associated with the northern tier.
- Domestic use regions: Flour mills, feed manufacturers, and food processors buy wheat in many states, often sourcing by rail or truck from producing regions.
- Export channels: Wheat moves to export through Gulf terminals, Pacific Northwest ports, Great Lakes and Atlantic routes, and in some cases cross-border channels with Canada or Mexico.
The US is usually both a major producer and a major exporter. Domestic food use is important and relatively stable compared with some other demand categories, while exports can fluctuate more sharply depending on US crop quality, Black Sea competition, freight, and currency conditions.
| Market segment | Main role | Typical users |
|---|---|---|
| Country elevator and local cash market | Physical grain buying from farmers | Farmers, cooperatives, local merchants |
| Processor or mill market | Purchasing wheat for food processing or feed use | Millers, food companies, feed manufacturers |
| Export terminal market | Assembling wheat for overseas shipment | Exporters, trading houses, importers |
| Futures and options market | Price discovery and risk management | Farmers, merchants, processors, funds, speculators |
How US wheat prices are formed
US wheat prices are formed through a combination of exchange-traded futures and regional cash market conditions. The best-known benchmark is the CME Group wheat complex, especially Chicago wheat, Kansas City wheat, and Minneapolis wheat. These contracts represent different wheat classes and are widely used for hedging and price discovery.
But a futures price is not the same as a local farm-gate price. A producer in Kansas, North Dakota, or Washington usually sees a cash bid from a local elevator or buyer, not just a board price. That cash bid reflects:
- the relevant futures benchmark,
- the basis, which is the local difference versus futures,
- protein and other quality factors,
- transport and elevation costs,
- storage availability,
- regional supply and demand,
- competition among buyers.
In export channels, prices may also be discussed as FOB values, meaning the price of grain loaded for export at port, excluding ocean freight. Importers may focus more on CIF prices, which include cost, insurance, and freight to the destination. A delivered mill price inside the US is different again: it includes transport to the consuming plant and often reflects tighter quality specifications.
| Price type | Where it is quoted | What it means |
|---|---|---|
| Futures price | CME Group contracts | Exchange-traded benchmark for price discovery and hedging |
| Local cash bid | Elevator, cooperative, merchant | Actual nearby physical buying price in a local market |
| Delivered price | Mill, feed plant, processor | Price including transport to a specific destination |
| FOB export price | Export terminal market | Price at the port for loading onto a vessel |
| CIF import price | Importer destination market | Price including freight and insurance to destination |
Main drivers of US wheat supply
US wheat supply depends first on acreage, yield, and harvested area. Unlike some crops, wheat supply is heavily shaped by class-specific weather patterns because different classes are grown in different climates and planting calendars. Winter wheat is planted in the fall and harvested the following summer, while spring wheat is planted in spring and harvested later in the season.
Important supply drivers include:
- Weather: Drought, excessive rain, freeze events, heat during grain fill, and harvest-time precipitation can all affect yield and quality.
- Acreage competition: Farmers may shift area between wheat and competing crops depending on expected returns, rotation needs, and moisture conditions.
- Abandonment rates: In drier Plains regions, planted area may not equal harvested area.
- Quality outcomes: Protein, test weight, disease pressure, and sprouting can materially change the value of a crop.
- Stocks carried in: Beginning stocks influence whether the market feels tight or comfortable before the new harvest arrives.
Because the US produces multiple classes, total tonnage is not the whole story. A crop with acceptable volume but lower milling quality can still tighten premium segments of the market.
Main drivers of US wheat demand
Demand for US wheat is split between domestic use and exports. Domestic food use is generally the most stable category, supported by flour demand from bakeries, food manufacturers, and retail consumption. Feed use can vary much more depending on wheat price relative to corn and the quality of the crop.
Export demand is often the most market-sensitive part of the balance sheet. US wheat competes with supplies from major exporting regions such as the Black Sea, the European Union, Canada, Australia, and Argentina. The US may gain or lose business depending on the following:
- relative wheat prices versus competing exporters,
- ocean freight conditions,
- US dollar strength,
- protein and milling quality availability,
- importer requirements and tender activity,
- logistics performance at rail, river, or port level.
Mexico, Japan, the Philippines, and other importing markets are traditionally important to US wheat trade, but destination demand can change over time. In any season, export sales pace matters because it indicates whether USDA export projections may be too high, too low, or roughly on target.
How wheat is actually bought, sold, exported, and hedged
Physical grain trade
Physical wheat in the US is normally sold through country elevators, cooperatives, grain merchants, processors, or direct contracts with end users. A farmer may deliver during harvest on a spot cash basis, use a forward contract before harvest, store grain after harvest, or choose a contract with later pricing features depending on local practice and counterparty terms.
Physical contracts typically address:
- delivery window,
- location,
- quality specifications,
- discounts or premiums,
- payment terms,
- ownership transfer and scale weights.
Exporters purchase wheat inland or at terminal positions, assemble train or barge loads where relevant, and move the grain to export ports. From there, wheat may be sold on an FOB basis to overseas buyers. The inland cash market and export market are tightly connected, but the export bid must still cover elevation, freight, handling, storage, and vessel loading economics.
Futures and options
Financial hedging is different from physical grain ownership. Futures and options allow market participants to manage price risk without necessarily buying or delivering actual wheat. US wheat futures are traded through brokerage accounts that provide access to CME Group markets. Commercial users may hedge wheat they intend to buy or sell physically; speculators may trade price direction only.
Key practical points include:
- Hedging: A farmer may sell futures to protect against falling prices, while a mill may buy futures to protect against rising prices.
- Basis risk: Even when futures are hedged, the local cash basis can still change.
- Margin: Futures positions require margin and can create gains or losses before physical grain is sold.
- Expiry and delivery concept: Most participants offset futures before delivery, but the contracts still anchor physical pricing relationships.
Monitoring prices online and selling physical grain are not the same action. A producer may watch futures every day online but still negotiate the actual sale with a local elevator. Likewise, a fund may trade wheat futures heavily without ever handling grain.
Where to check US wheat prices and market information
Readers should avoid treating any single online quote as the whole US wheat market. To understand prices properly, it is useful to compare futures, basis, export indications, and official supply-and-demand reports.
Reliable places to check include:
- CME Group: For US wheat futures and options benchmarks, including Chicago, Kansas City, and Minneapolis-related contracts where listed through the exchange complex.
- USDA World Agricultural Supply and Demand Estimates (WASDE): For national balance sheets and updated official supply-and-demand projections.
- USDA National Agricultural Statistics Service (NASS): For acreage, crop progress, crop production, and stocks-related reporting.
- USDA Foreign Agricultural Service (FAS): For export sales, trade context, and global market information.
- Local elevators, cooperatives, and grain merchants: For actual cash bids in a specific local market.
- Regional or state extension and market services: Often useful for basis education and local merchandising practice.
If someone wants the “current US wheat price,” the practical answer is to specify the market first: Chicago futures, Kansas City futures, Minneapolis spring wheat benchmark, a Gulf export indication, or a local elevator cash bid in a specific state. These can differ materially at the same moment.
What to watch in a forward-looking supply and demand outlook
Forecasting US wheat supply and demand should be done in scenarios, not certainties. The market reacts not only to current conditions but also to changes in expected production, domestic use, and export competitiveness.
| Scenario | Conditions | Potential market implication |
|---|---|---|
| Tighter supply scenario | Weather damage, lower harvested area, quality losses, or stronger exports | Supportive for futures and/or basis, especially in affected classes |
| Comfortable supply scenario | Good yields, larger stocks, slower exports, or weak feed demand | Pressure on prices and potentially softer basis in surplus regions |
| Quality-driven market split | Adequate total crop but uneven protein or milling quality | Premiums for higher quality wheat even if broad futures remain subdued |
| Export competitiveness shift | Changes in US dollar, rival exporter supply, or freight economics | US export demand can improve or weaken quickly |
For practical analysis, watch crop conditions during the growing season, harvest progress, export sales momentum, class-specific quality reports, and USDA balance sheet revisions. Also watch corn prices, because feed substitution can influence whether wheat stays in milling channels or moves more competitively into feed demand.
Frequently asked questions
What is the main benchmark for US wheat prices?
The main benchmarks are US wheat futures traded through CME Group, especially Chicago wheat, Kansas City wheat, and Minneapolis-related wheat pricing references. Which benchmark matters most depends on wheat class and region.
Where can I check a real US wheat cash price?
The most practical place is a local elevator, cooperative, grain merchant, or processor in the specific region where grain would be delivered. Cash bids are local and can differ significantly from exchange futures.
Why is the local wheat price different from futures?
Because local cash prices include basis, which reflects freight, handling, storage, supply and demand, buyer competition, and quality factors. Futures are a benchmark, not a universal farm-gate price.
How is US wheat exported?
Wheat is bought inland by merchants or exporters, moved by truck, rail, barge where applicable, or direct terminal logistics, and then loaded at export ports. Export trade is commonly discussed on an FOB basis at the port.
Can someone trade US wheat online without buying physical grain?
Yes. Futures and options can be traded through a broker for price exposure or hedging. That is a financial position and does not automatically mean ownership of physical wheat.
What units are commonly used in the US wheat market?
US futures are commonly quoted in cents per bushel. Export trade and international comparisons often use US dollars per metric ton. Physical contracts may use bushels or tons depending on the market and buyer.
What are the biggest drivers of US wheat supply and demand?
Weather, acreage, yields, quality, beginning stocks, export competitiveness, domestic flour demand, feed substitution, freight conditions, and currency movements all matter.
Which official reports does the market watch most closely?
USDA WASDE, USDA NASS crop and stocks reports, crop progress updates, and USDA export sales reporting are among the most closely followed sources.
Sources
- US Department of Agriculture, World Agricultural Supply and Demand Estimates
- US Department of Agriculture, National Agricultural Statistics Service
- CME Group