
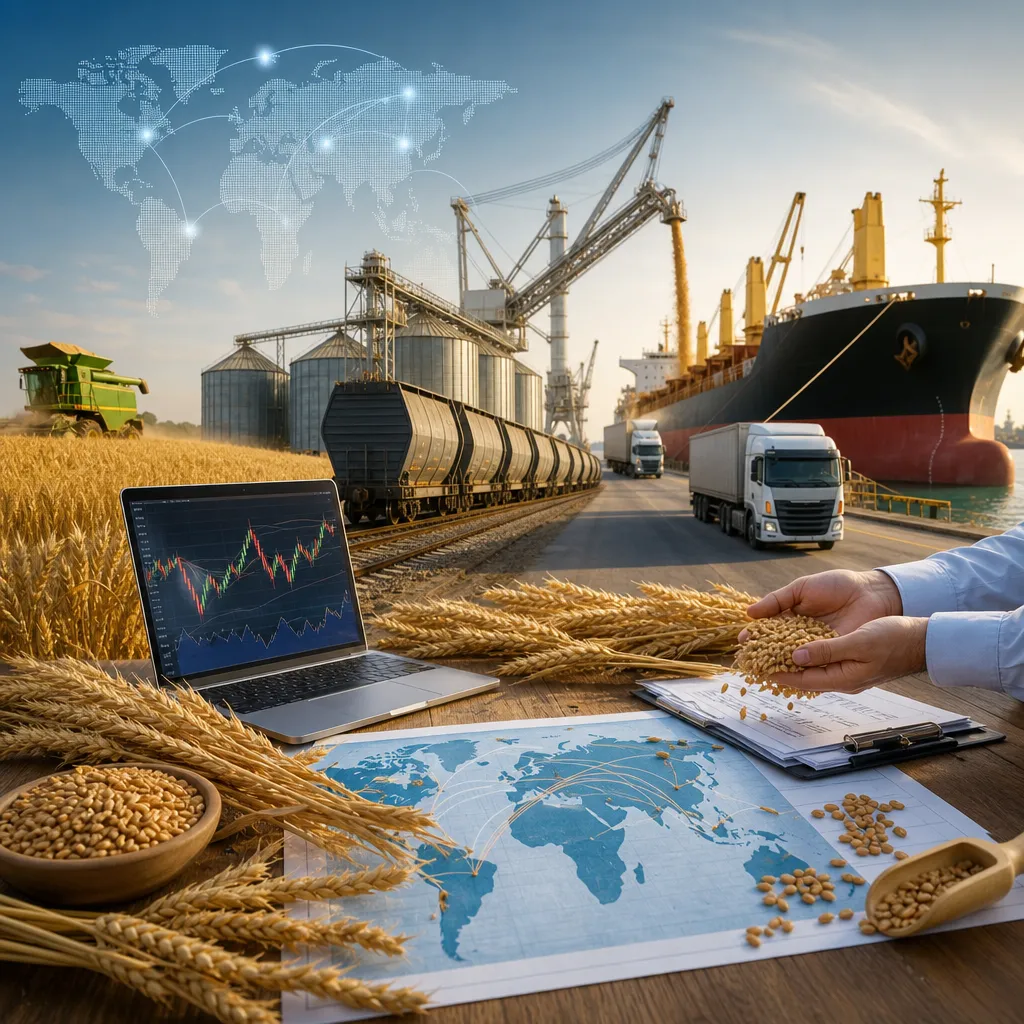
The largest wheat exporters are usually a small group of countries that move surplus wheat from major producing regions into deficit markets in North Africa, the Middle East, Asia, and parts of Sub-Saharan Africa. In practice, the list changes over time with weather, war, government policy, freight, exchange rates, and crop quality, but the countries most often discussed are Russia, the European Union, Canada, the United States, Australia, and Ukraine. For anyone using this market, the important point is not just who exports the most, but how those exports are priced, where they are shipped from, and which reports and benchmarks traders watch. Wheat export leadership affects global grain prices, local cash bids, freight flows, and hedging decisions across the entire grain trade.
Who the largest wheat exporters are
In most marketing years, the world wheat export market is dominated by a handful of origins. Russia has often been the leading exporter in recent years, while the European Union, Canada, the United States, Australia, and Ukraine are also core suppliers. Argentina and Kazakhstan can also matter, especially in certain regional trade flows or in years when production is strong.
These rankings should never be treated as fixed. A drought in Australia, a poor spring wheat crop in Canada, Black Sea export restrictions, or a stronger euro can quickly reshuffle market share. Export volume depends on more than production alone. A country can harvest a large crop but export less if domestic feed demand rises, government controls tighten, logistics fail, or quality is too low for key milling markets.
| Exporter | Why it matters | Typical strengths | Main constraints |
|---|---|---|---|
| Russia | Often a major price setter in global wheat trade | Large exportable surplus, competitive Black Sea freight position | Policy risk, sanctions-related friction, logistics and payment complexity |
| European Union | Large and diverse exporter from multiple member states | Big production base, established ports, broad customer network | Weather variability, internal quality differences, currency effects |
| Canada | Important supplier of high-protein milling wheat | Consistent quality reputation, strong spring wheat segment | Rail and port bottlenecks, crop sensitivity to dryness |
| United States | Major exporter across several wheat classes | Deep futures market, multiple ports, established grading system | Can be uncompetitive on price, internal freight costs |
| Australia | Key supplier into Asia | Strong geographic position for Asian destinations | High weather volatility, especially tied to rainfall patterns |
| Ukraine | Important Black Sea origin when logistics function normally | Competitive export location, major role in regional flows | War risk, corridor uncertainty, infrastructure damage |
How wheat exports actually work
Wheat exports are physical grain transactions, not just numbers on a screen. The chain normally starts with farmers delivering grain to local elevators, cooperatives, collectors, or merchants. That grain may then be stored, blended, cleaned, tested, moved by truck or rail to inland terminals, and finally transferred to port elevators for vessel loading.
The exporter is often a large grain merchant, cooperative, trading house, processor with export capacity, or state-linked buyer in some markets. The end customer may be a flour mill, government buying agency, feed manufacturer, or importer. Each deal depends on grade, protein, moisture, falling number, test weight, contamination limits, freight, insurance, vessel timing, and payment terms.
Most large export business is negotiated privately in the physical market. It may be priced against a futures market plus or minus a basis, or directly on an FOB or CFR basis. FOB means free on board at the export port. CFR means cost and freight to the destination port, usually excluding insurance unless the term is CIF instead.
Typical physical export flow
- Farmer sells wheat to an elevator, cooperative, merchant, or processor.
- Buyer checks grade and quality and sets the local cash price or basis.
- Grain is stored or assembled into exportable volume.
- Exporter books rail, barge, truck, or port handling capacity.
- Shipment is sold to an overseas buyer on agreed Incoterms and quality specs.
- Inspection, certification, vessel loading, and shipping take place.
- Payment is settled under the sales contract, often using trade finance and documentary processes.
Where prices are discovered and checked
There is no single global wheat cash price. Market participants normally watch a mix of futures, export offers, tender results, and local cash bids. The benchmark that appears in headlines is often a futures contract, but exporters and farmers do not automatically receive that price.
For listed futures, the most widely followed benchmark is Chicago wheat at CME Group, especially soft red winter wheat futures. Kansas City wheat futures at CME are also important for hard red winter wheat, and Minneapolis spring wheat futures are widely used for higher-protein spring wheat. In Europe, Euronext milling wheat futures are important for EU trade and Black Sea competition.
For physical export pricing, traders monitor FOB values from major ports, government tender prices, and merchant indications. Importers in Egypt, Algeria, Indonesia, and other large consuming countries often influence world values through public or semi-public tenders. Exporters also watch spread relationships between origins, such as Black Sea wheat versus EU or US Gulf wheat.
Farmers and local grain sellers usually check nearby elevator bids, cooperative bids, processor bids, and regional market reporting services. In the United States, USDA Agricultural Marketing Service reports can help show cash market conditions. In other countries, local exchanges, grain boards, cooperatives, merchants, and agriculture ministries may publish indicative prices or bids. These local cash prices differ from futures because of basis, freight, storage, location, and quality.
| Market reference | What it shows | Where it is used | Main limitation |
|---|---|---|---|
| CME wheat futures | Exchange-traded benchmark price | Hedging, spreads, futures analysis | Not the same as a local cash bid |
| Euronext milling wheat futures | European benchmark for milling wheat | EU trade, hedging, export competitiveness analysis | Reflects contract specs, not every export quality |
| Local elevator or cooperative bid | Cash price at a real delivery point | Farm marketing, physical sale decisions | Highly location and quality specific |
| FOB export offer | Price for wheat loaded at export port | International trade negotiations | May be indicative rather than broadly accessible |
| Import tender result | Actual buying interest from destination markets | Export competition and price discovery | Can reflect one cargo, one timing window, or special terms |
Why the biggest exporters matter to prices worldwide
Large exporters shape the world market because wheat is not fully interchangeable by origin, but the major origins compete directly in many import destinations. If Russian FOB values fall, EU and US exporters often need to respond to remain competitive. If Australian production rebounds after drought, Asian buyers may switch origins. If Canadian protein wheat is short, mills may bid more aggressively for US spring wheat or alternative blends.
Export share affects global supply perception, but logistics often matter just as much as crop size. A country with an excellent harvest can still lose export competitiveness because of river problems, rail congestion, limited port capacity, or slow vessel lineups. Currency moves also matter. A weaker exporting-country currency can make grain cheaper in dollar terms even if local farm prices stay firm.
For analysts, the most important indicators are usually exportable surplus, pace of shipment, port lineups, import tenders, and quality. For example, a bumper crop of feed-grade wheat does not solve a shortage of high-quality milling wheat. That distinction matters for mills, exporters, and futures spreads.
How futures and hedging relate to wheat exports
Global wheat exports are physical trade, but the price risk is often managed through futures and sometimes options. Futures are standardized contracts traded on regulated exchanges such as CME Group or Euronext. They allow exporters, mills, merchants, and sometimes farmers to hedge against adverse price moves.
An exporter buying wheat inland for future shipment may sell wheat futures to reduce flat-price risk. A mill needing imported wheat may buy futures or call options to protect against rising prices while negotiating physical supply. A farmer may hedge part of expected production using futures or choose a forward cash contract with a local buyer instead.
Access to exchange-traded futures normally requires a brokerage account with a regulated futures broker. This is different from opening a cash account with an elevator or signing a contract with a grain merchant. Futures trading involves margin, daily mark-to-market, contract expiry, and potential delivery rules. It is not the same as taking ownership of warehouse grain or booking a vessel cargo.
The key risk to understand is basis risk. A hedge may protect against broad futures price movement, but the local cash market can still change relative to futures because of freight, quality, regional supply, or export demand. That is why a farmer should not assume a rise in Chicago wheat futures will automatically raise the local price by the same amount.
Where to find reliable export data and market reports
For global wheat exporter rankings and trend analysis, USDA is one of the main public sources. The monthly WASDE report gives supply, use, and trade estimates by country. The Grain: World Markets and Trade publication is especially useful for export comparisons, importer demand, and changes in trade flows.
For US-specific export pace, USDA’s weekly Export Sales report and some AMS market reports help show commitments and shipment activity. For futures market structure and participation, CME Group provides contract information and price data, while the CFTC publishes Commitments of Traders reports that show how different trader categories are positioned in US futures markets.
For international context, FAO provides broad food and grain market information. In Europe, the European Commission publishes agriculture market data and trade analysis, while Eurostat can help with official trade statistics. National agriculture ministries, customs agencies, and statistical offices may provide country-level production and export numbers, though reporting frequency and detail vary.
Commercial data vendors also provide port lineups, vessel tracking, freight indications, and cash market intelligence, but availability depends on subscription. Those tools are widely used by merchants, crushers, mills, analysts, and hedge desks, especially when official data is delayed.
How farmers, traders, and buyers use exporter rankings in practice
Farmers use exporter rankings mainly to understand demand context, not to sell directly into world trade in most cases. If a major exporter has a crop problem, local bids in competing origins may improve. If Black Sea wheat becomes aggressively priced, local basis in other exporting countries may weaken even when futures are steady.
Grain merchants and exporters use rankings more directly. They compare origin competitiveness by protein, destination, freight route, and shipment window. They also monitor political risk, export taxes, and payment systems. A nominally cheap origin may still be unattractive if documentary risk, banking friction, or load-port delays are high.
Importers and mills use rankings to diversify supply. A buyer rarely wants to depend on one origin if weather, war, sanctions, or port disruption could interrupt flow. Larger importers often buy a portfolio of origins across the season. They may also vary quality blends to control cost while meeting flour or feed specs.
Main risks and limitations when analyzing wheat exporters
The first limitation is that annual export rankings hide timing. A country may dominate one quarter and then fade as stocks tighten. The second is quality. Two exporters can ship similar tonnage but serve different end uses. The third is that policy can override economics. Export quotas, taxes, inspections, or unofficial restrictions can disrupt trade even when grain is available.
Another common mistake is treating exchange prices as global physical truth. Futures are essential benchmarks, but export values are shaped by vessel freight, loading capacity, origin quality, sanctions risk, and buyer terms. Likewise, customs statistics can lag reality, and headline crop estimates can change sharply with weather.
For practical market work, the best approach is to combine several layers: official balance sheets, weekly export flow data, futures structure, tender activity, local basis, and weather in the main exporting regions. No single dataset is enough.
FAQ
Where can I check which countries export the most wheat?
The most widely used public source is USDA, especially the monthly WASDE report and the Grain: World Markets and Trade publication. These reports compare major exporters and importers by marketing year. FAO and official trade statistics from national or regional authorities can also help for historical checks.
Where are global wheat prices quoted?
Global wheat pricing is usually referenced through futures at CME Group and Euronext, plus physical FOB export offers and import tender results. Farmers selling physical grain normally check local elevator, cooperative, merchant, or processor bids rather than relying only on futures screens.
Can I buy wheat directly from a major exporting country online?
Large export cargoes are usually traded through grain merchants, exporters, brokers, or import procurement teams, not simple retail websites. Small industrial or feed buyers may source through local merchants or brokers. To buy internationally, the buyer normally needs specifications, shipping terms, finance, inspection arrangements, and legal documentation.
Is trading wheat futures the same as buying physical wheat?
No. Futures are financial contracts traded on regulated exchanges through a broker and are commonly used for hedging or speculation. Physical wheat is bought through elevators, merchants, exporters, processors, or import contracts and involves delivery, quality, freight, and payment terms.
Why does my local wheat bid differ from Chicago wheat futures?
Because the local cash bid includes basis. Basis reflects freight, storage, handling, regional supply and demand, quality, and buyer competition. Chicago futures are a benchmark, but the actual cash price at your delivery point can move differently.
Which reports matter most for wheat export analysis?
USDA WASDE, USDA Grain: World Markets and Trade, USDA Export Sales for US pace, CME contract data for benchmark markets, and CFTC Commitments of Traders for futures positioning are among the most useful public tools. Regional market agencies and official customs data add detail by origin.
Who usually sells export wheat in the physical market?
Typically grain merchants, exporters, cooperatives, and sometimes processors with export programs. Farmers often sell first to local elevators or cooperatives unless they have the scale and logistics to contract more directly into export channels.
What is the biggest risk in relying on exporter rankings alone?
Rankings do not show quality, timing, logistics, policy risk, or freight competitiveness. A country can be a major exporter on paper yet still be unreliable for certain shipment windows or quality needs. Serious analysis always goes beyond the headline ranking.
Sources
- USDA World Agricultural Supply and Demand Estimates (WASDE)
- USDA Foreign Agricultural Service, Grain: World Markets and Trade
- CME Group wheat futures contract information