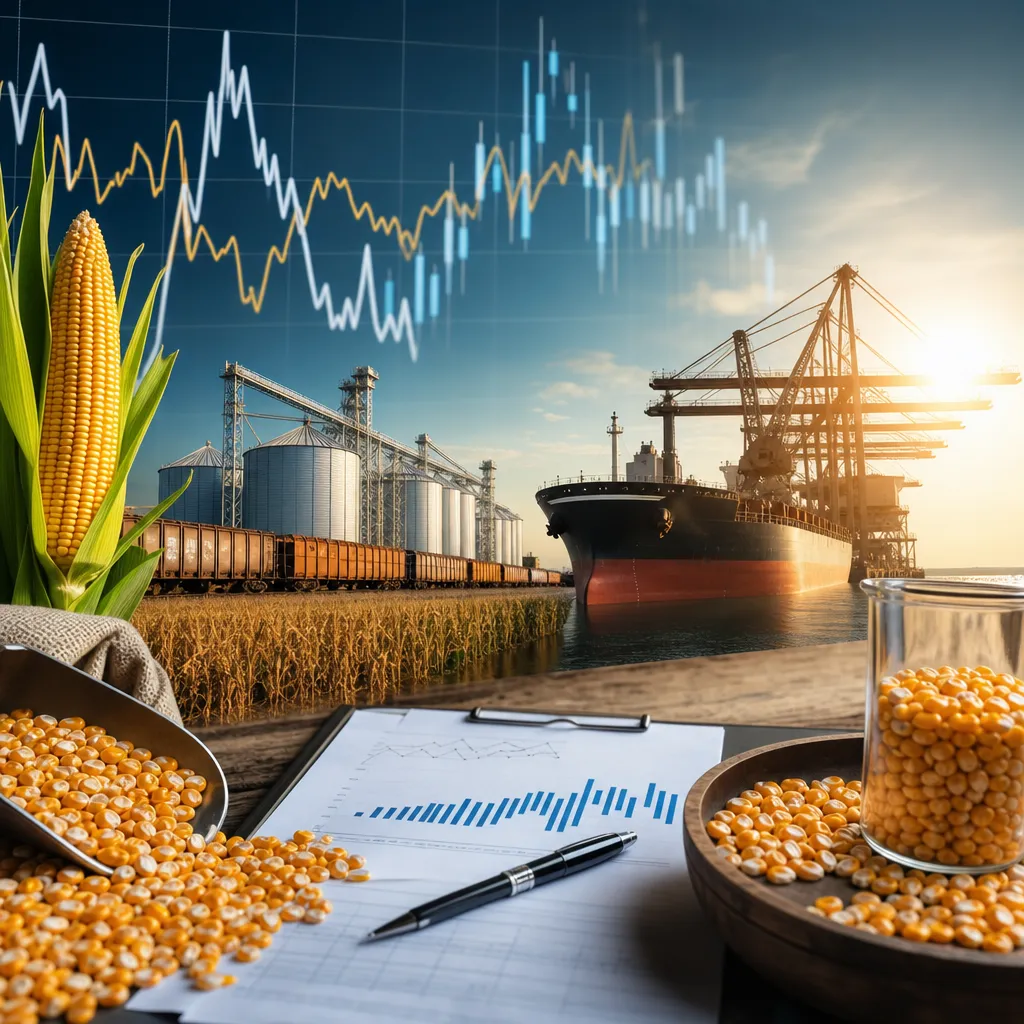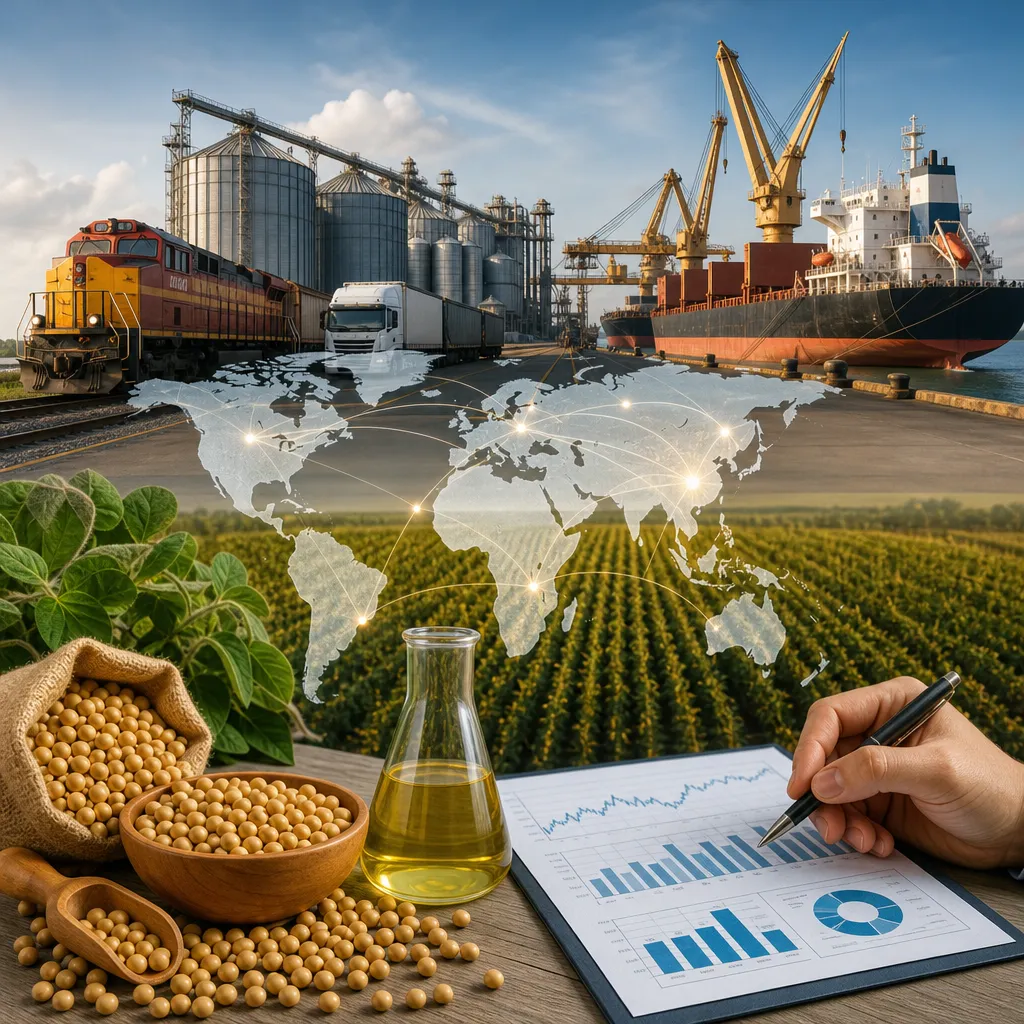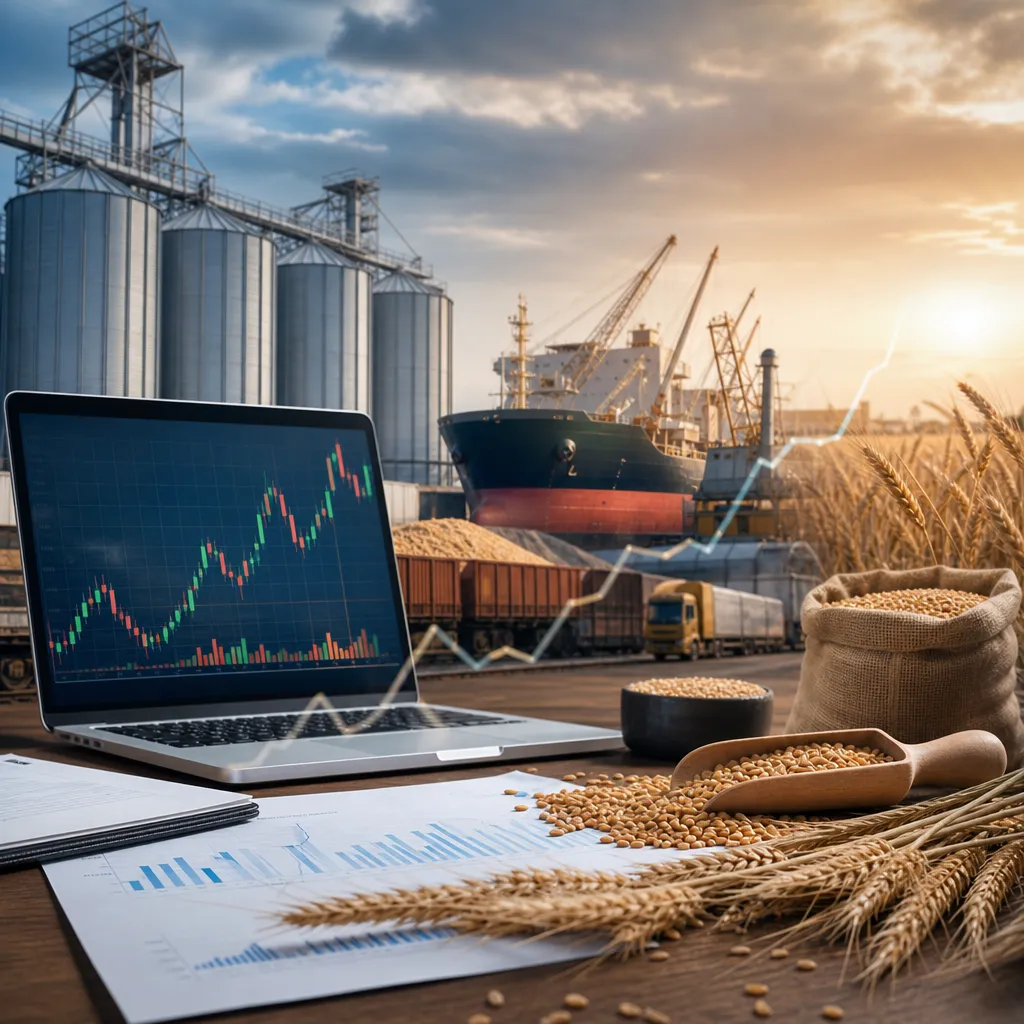


Grain prices are the result of supply meeting demand across two linked but different markets: the exchange-traded futures market and the physical cash market. Futures prices are quoted continuously on regulated exchanges and reflect broad expectations for a standard contract, while cash prices are the bids and offers actually available at a local elevator, processor, feed mill, port, or merchant for grain of a specific quality and delivery point. To understand grain prices in practice, a farmer, trader, buyer, or analyst has to look at both. The key is not just asking “what is the price,” but “which market, which location, which quality, and for which delivery period?”
How grain prices are formed
At the most basic level, grain prices move because supply and demand change. Supply depends on planted area, yield, harvested production, beginning stocks, imports, and how much grain is actually available to the market after on-farm feeding, seed use, or losses. Demand comes from food, feed, exports, biofuels, crushing, milling, and industrial use.
Markets reprice quickly when expectations change. A dry weather forecast in a major corn belt can raise prices before any crop is harvested. Weak export sales can pressure prices even when production is unchanged. Currency moves also matter: if an exporting country’s currency weakens, its grain may become more competitive on world markets.
In practice, grain prices usually reflect three layers:
- Global benchmark value from futures or export markets.
- Regional basis, which adjusts for local supply, demand, and logistics.
- Quality and contract terms, such as protein, moisture, damage, test weight, delivery period, and freight.
Futures prices versus local cash prices
This is the most important distinction in grain marketing. A futures quote is not automatically the price a farmer receives or a buyer pays in the physical market.
Futures are standardized contracts traded on regulated exchanges. For example, wheat, corn, soybeans, oats, canola, and rapeseed futures may trade on exchanges such as CME Group or ICE, depending on the crop and region. These contracts specify quantity, quality standards, delivery months, and approved delivery locations. Most participants use them for price discovery and risk management rather than making delivery.
Cash grain is the real commodity being bought or sold physically. A local elevator bid for corn reflects the exchange reference price, plus or minus basis, plus any quality discounts or premiums, minus freight or handling where relevant. Basis is the difference between local cash and futures. It can strengthen when nearby demand is strong or logistics are tight, and weaken when harvest pressure or transport bottlenecks increase local supply.
| Market type | What price shows | Where it is found | Who uses it |
|---|---|---|---|
| Futures market | Standardized exchange price for a contract month | Commodity exchange data, broker platforms, market-data vendors | Traders, hedgers, analysts, merchants, processors |
| Local cash market | Actual bid or offer at a delivery location | Elevators, cooperatives, merchants, processors, local bid sheets | Farmers, local buyers, feed mills, physical traders |
| Export or port market | Price for shipment at port or export position | Export merchants, brokers, port bids, trade reporting services | Exporters, importers, merchants, large producers |
Where to check grain prices in practice
If you want exchange prices, the usual sources are exchange websites, licensed market-data platforms, and futures broker platforms. CME Group is widely used for U.S. grain futures such as corn, soybeans, wheat, oats, and soybean products. ICE is relevant for some oilseed and regional contracts, including canola in Canada. Contracts are quoted by delivery month, unit, and currency, so readers should check the exact contract before comparing values.
If you want local physical prices, the normal places to check are:
- Grain elevators and cooperatives posting daily cash bids.
- Merchants and processors offering spot and forward contracts.
- Feed mills, flour mills, crushers, maltsters, and ethanol plants where direct procurement is common.
- Government or semi-official market reporting systems in countries that publish regional spot prices or terminal market data.
- Brokers in physical grain markets who arrange transactions between buyers and sellers.
Online, many elevators and cooperatives publish bids on their own websites or through farm-marketing software. In the physical market, the same price may also be available by phone, messaging, or contract notice from a merchant. A port bid may look attractive, but inland freight, line-up risk, storage, and quality specifications can reduce the net farmgate value.
When checking any price, confirm:
- crop and grade,
- protein or oil level if relevant,
- delivery location,
- delivery period,
- currency,
- unit of measure,
- whether freight is included or deducted.
How supply and demand actually move grain prices
Supply and demand analysis is practical when broken into a few repeatable questions. For each crop, market participants usually ask:
- How many acres or hectares were planted?
- What is the likely yield?
- How much production does that imply?
- How large are beginning and ending stocks?
- Are exports accelerating or slowing?
- Are feed, food, crush, or biofuel users profitable enough to buy more?
- Are imports needed, or is the region exportable?
Stocks matter because they show how much buffer exists. A crop with tight stocks-to-use is usually more sensitive to weather problems or export surprises. A crop with large carryout can absorb moderate production losses more easily.
| Factor | Typical effect on price | How it is checked |
|---|---|---|
| Adverse weather | Often bullish if yield risk rises | Weather models, crop condition reports, field observations |
| Large harvest | Often bearish unless demand also grows | Harvest reports, production estimates, storage pressure |
| Strong exports | Supports prices and basis | Export sales, customs data, port line-ups |
| Weak feed or crush demand | Can pressure prices | Processor margins, animal numbers, energy economics |
| Logistics disruption | Can widen regional basis and distort local prices | Rail, river, truck, port, and warehouse conditions |
Reports and data sources that matter most
For serious grain analysis, the most-used public reports usually come from official agencies and exchanges. These are not all live pricing tools, but they are core references for supply-and-demand work.
USDA is central for global and U.S. grain analysis. WASDE is widely used for world and U.S. balance sheets. Crop Progress helps track growing conditions and harvest pace. Grain Stocks, Acreage, Prospective Plantings, and Export Sales reports are also key. These reports are used by farmers, traders, merchants, feed buyers, and analysts to compare actual or expected supply against demand.
CME Group provides contract specifications, settlement data, futures and options information, delivery rules, and market structure details. This is important for anyone hedging or comparing a local bid to a benchmark futures contract.
CFTC publishes Commitments of Traders, which show how different classes of market participants are positioned in U.S. futures and options markets. It is useful for understanding market participation, though it should not be used alone as a price forecast.
FAO, national agriculture ministries, statistical offices, customs agencies, and regional commissions can provide production, trade, and food-security context, especially outside the United States. In importing countries, customs and port data can be as important as production estimates.
How physical grain is bought and sold
Physical grain trade usually happens through a chain of counterparties rather than directly on a futures exchange. Farmers may deliver to a local elevator or cooperative, negotiate directly with a mill or feed company, contract with a processor, or sell through a grain merchant or broker. Larger commercial flows may move from country elevators to terminal elevators, processors, or exporters.
A basic physical transaction usually includes:
- Commodity description: wheat, corn, soybeans, barley, oats, rye, sorghum, canola, sunflower seed, and so on.
- Quality terms: grade, moisture, protein, oil, foreign material, test weight, falling number, damage, toxins where relevant.
- Quantity: truckload, railcar, container, barge, or vessel lot.
- Delivery point: farm pickup, elevator, processor, warehouse, or port.
- Timing: spot, nearby, or forward delivery.
- Price structure: flat price, futures plus basis, basis-only, or minimum-price structures where offered.
- Payment and title terms: when title passes, inspection process, and when payment is due.
Where it takes place depends on scale. Farm-scale sales often happen with local elevators and cooperatives. Regional processors and feed manufacturers may buy direct. Export volumes generally move through merchants and port systems. International trade may involve FOB, CFR, or other Incoterms, but the exact term matters because it determines who pays freight, insurance, and risk during transit.
Futures, options, and hedging
Futures and options are financial tools used to manage price risk, not the same as purchasing truckloads of grain. To trade them, a participant typically needs a futures account with a regulated broker that offers exchange access. Orders are placed on a broker platform connected to the exchange. Margin is required for futures because the position is leveraged, and losses can exceed the initial amount posted.
Farmers and grain owners use futures to hedge by selling futures against expected production or inventory. Buyers such as mills, crushers, or feed manufacturers may buy futures to protect against rising prices. Options are used when a participant wants price insurance with limited downside to the premium paid, though options involve their own complexity, including time value and volatility effects.
Hedging reduces exposure to broad price moves, but it does not eliminate basis risk. A producer who sells futures may still face a weaker local basis at the time of physical sale. Likewise, a processor who buys futures may still see local cash premiums rise.
Common access points for futures and options include:
- regulated futures brokers,
- institutional execution platforms,
- commercial risk-management advisers,
- merchant hedging desks for larger physical clients.
Buying physical grain for feed or processing generally does not require a futures account. It normally requires a commercial contract with a seller, agreed delivery terms, and operational capability to receive, inspect, and pay for the grain.
Storage, logistics, and quality in price discovery
Storage and logistics strongly affect realized grain prices. During harvest, local cash prices often weaken because elevators and transport systems are congested. If storage is available, sellers may be able to hold grain and wait for stronger basis or a better carry structure. But storage is not free: there are costs for aeration, shrink, handling, interest on inventory, insurance, and quality risk.
On-farm storage gives flexibility, but quality must be managed carefully. Moisture, temperature, insects, mold, and spoilage can turn a pricing decision into a loss. Commercial elevators and warehouses may offer cleaning, drying, grading, and storage services, but their tariffs, discounts, and liability terms vary. Export and processor markets may reject grain that fails quality standards even if the futures market for that crop appears strong.
Logistics also create regional price differences. River levels, rail availability, truck shortages, vessel congestion, and port capacity can all widen basis. That is why electronic market data should always be checked against real physical conditions.
Practical ways to analyze grain prices
A practical grain-price workflow usually combines public reports, local bids, and benchmark futures. For a farmer, merchandiser, or buyer, a useful routine is:
- Check benchmark futures for the relevant crop and contract month.
- Collect local cash bids from elevators, cooperatives, processors, and merchants.
- Compare basis across locations and delivery periods.
- Read the latest supply-and-demand reports and export data.
- Track weather in major producing regions, not just locally.
- Review logistics and storage conditions.
- Decide whether the risk is best managed with a cash sale, forward contract, hedge, or storage.
Software and data tools vary by purpose. Market-data platforms focus on futures, options, charting, and analytics. Farm-marketing software may aggregate local bids, contracts, positions, and hedge tracking. Enterprise grain-trading systems are used by merchants, processors, and exporters for position management, freight, contracts, and inventory. An API is generally useful for analysts or developers who need structured data feeds for dashboards, models, or automated reporting.
Where can I check grain prices today?
Check exchange websites or broker platforms for futures prices, and check local elevators, cooperatives, processors, or merchants for physical cash bids. If you need the price you can actually sell at, local bids matter more than a headline futures quote.
What is the difference between grain futures and cash grain?
Futures are standardized exchange contracts used for price discovery and hedging. Cash grain is the physical commodity traded at a real location with specific quality and delivery terms. The difference between them is basis.
Where do farmers usually sell physical grain?
Most commonly to elevators, cooperatives, processors, feed mills, grain merchants, or exporters through local collection systems. The best outlet depends on freight, storage access, quality, and timing.
How do processors and feed buyers purchase grain?
They may buy directly from producers, through merchants, via brokers, or from elevators and warehouses. Contracts usually specify quality, delivery schedule, quantity, and payment terms.
Can I buy grain online?
Market information and sometimes offer discovery may exist online, but physical grain purchase still requires a commercial agreement covering quality, delivery, freight, inspection, and payment. Online futures trading is different from buying actual grain.
Which reports are most useful for grain supply and demand?
USDA WASDE, Crop Progress, Grain Stocks, Acreage, and Export Sales are among the most used for U.S. and world grain analysis. CME contract information and CFTC positioning reports are also valuable for market interpretation.
Why does my local price differ from the exchange price?
Because local price includes basis, quality adjustments, freight, handling, local supply-demand conditions, and delivery timing. Exchange prices reflect a standardized contract, not your exact location or grain quality.
What are the main risks in storing grain for a better price?
Quality loss, spoilage, shrink, storage and financing cost, weaker basis, and the possibility that futures prices fall before sale. Storage adds marketing flexibility, but it does not guarantee a higher net return.
Sources
- USDA World Agricultural Supply and Demand Estimates
- CME Group
- U.S. Commodity Futures Trading Commission Commitments of Traders