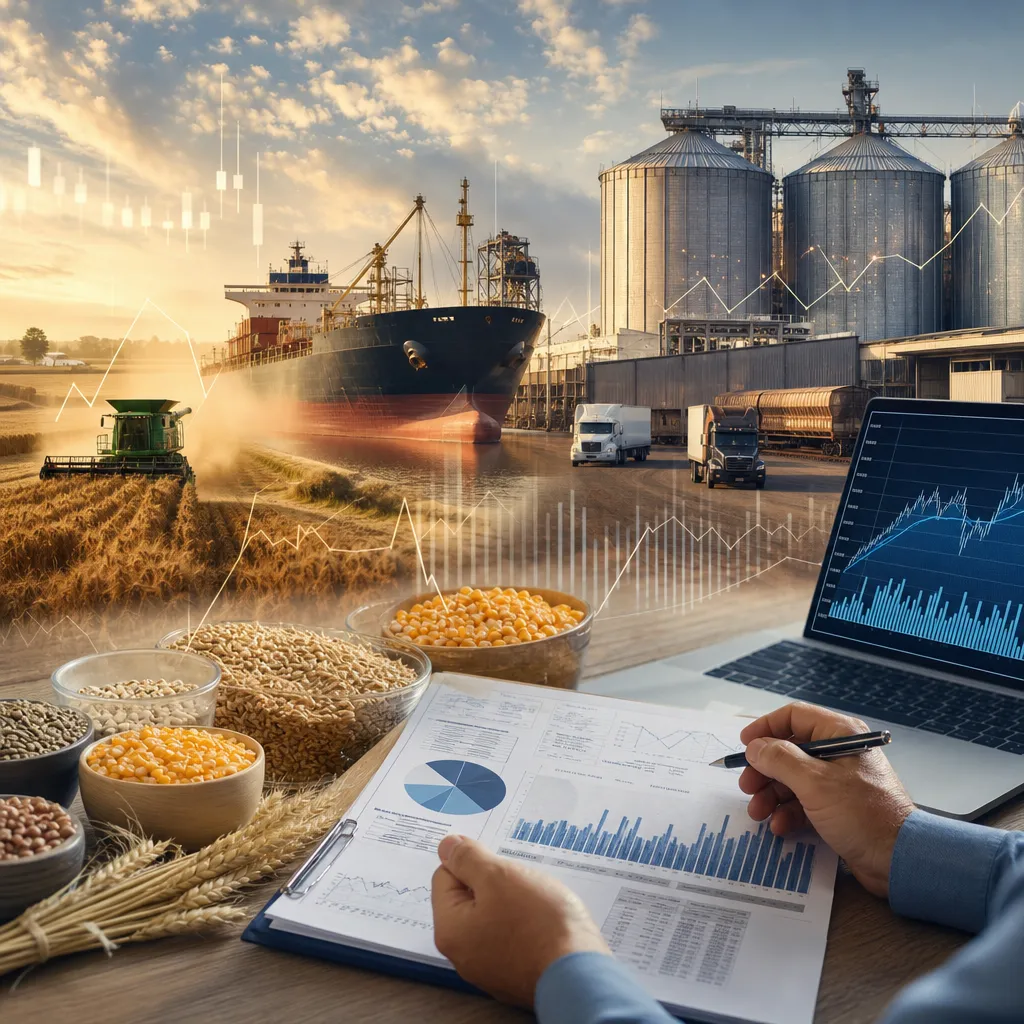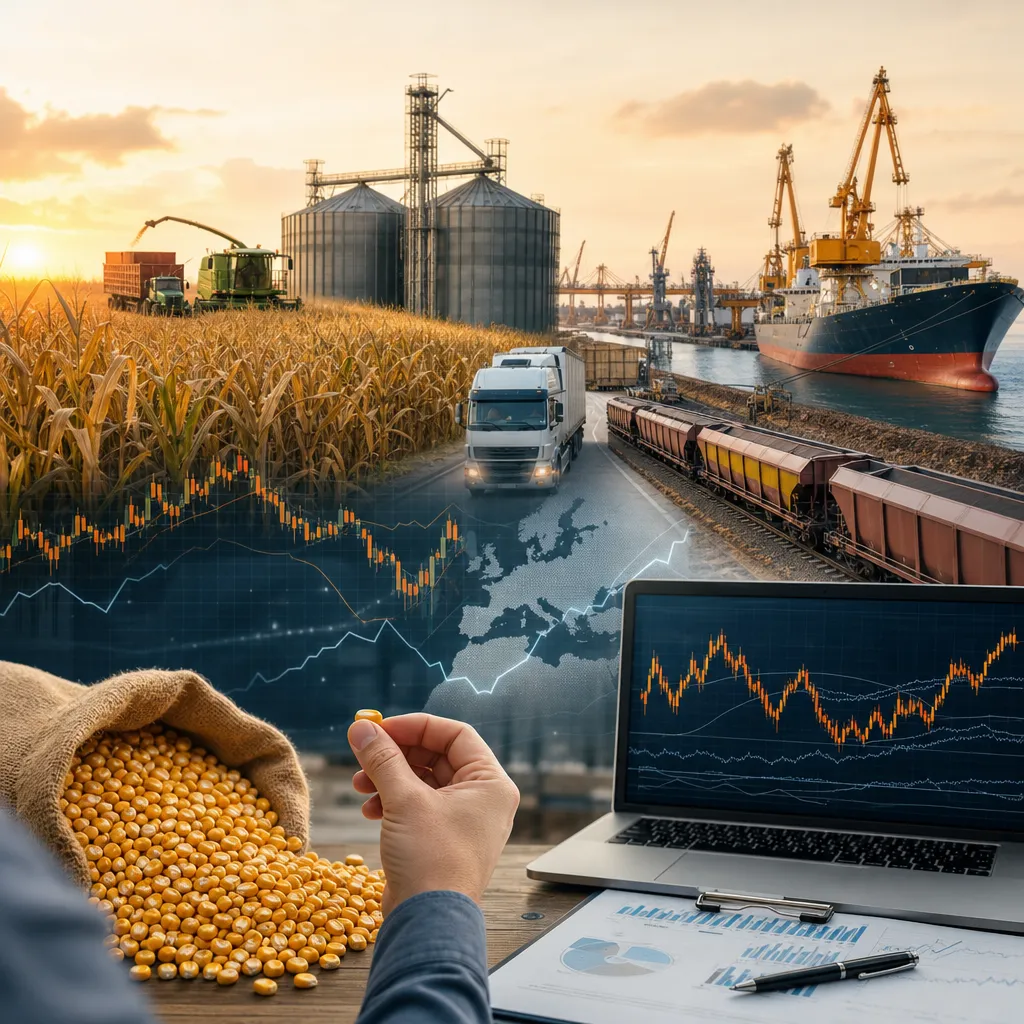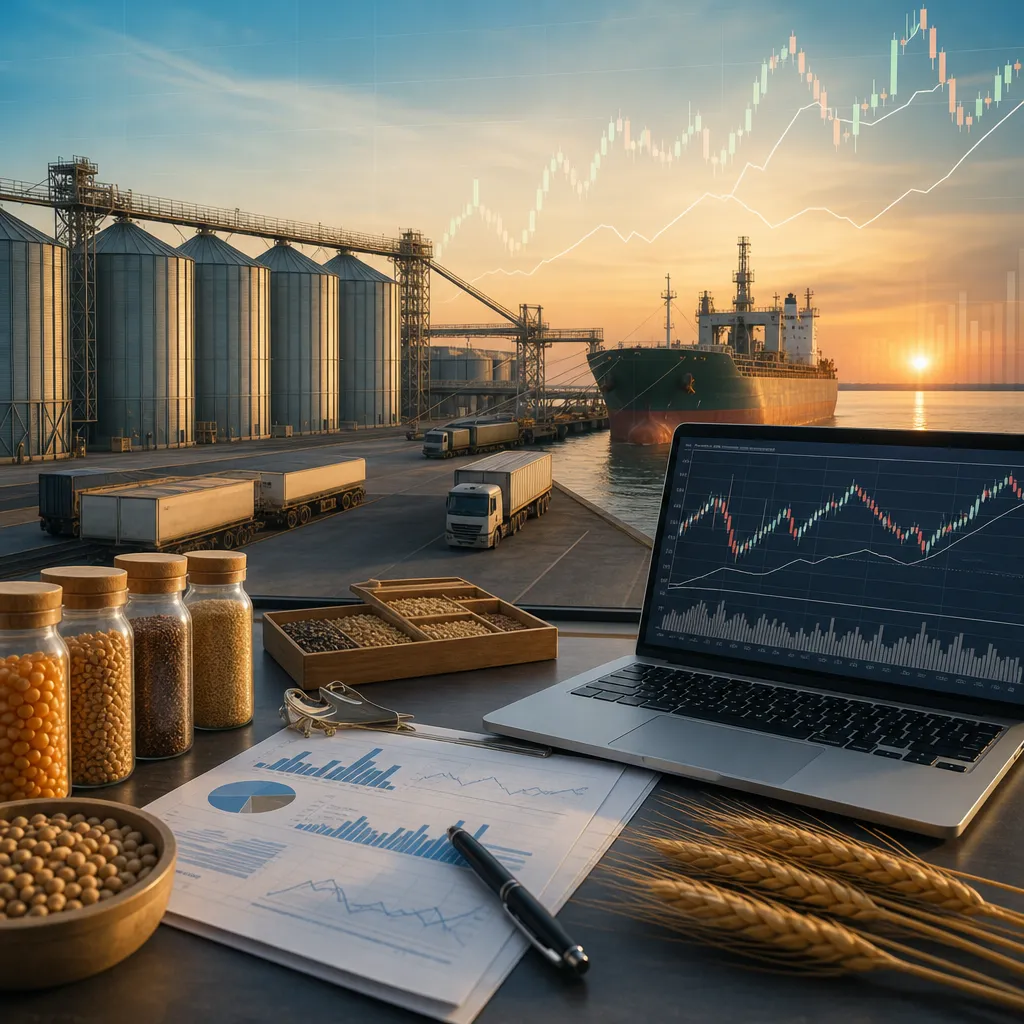

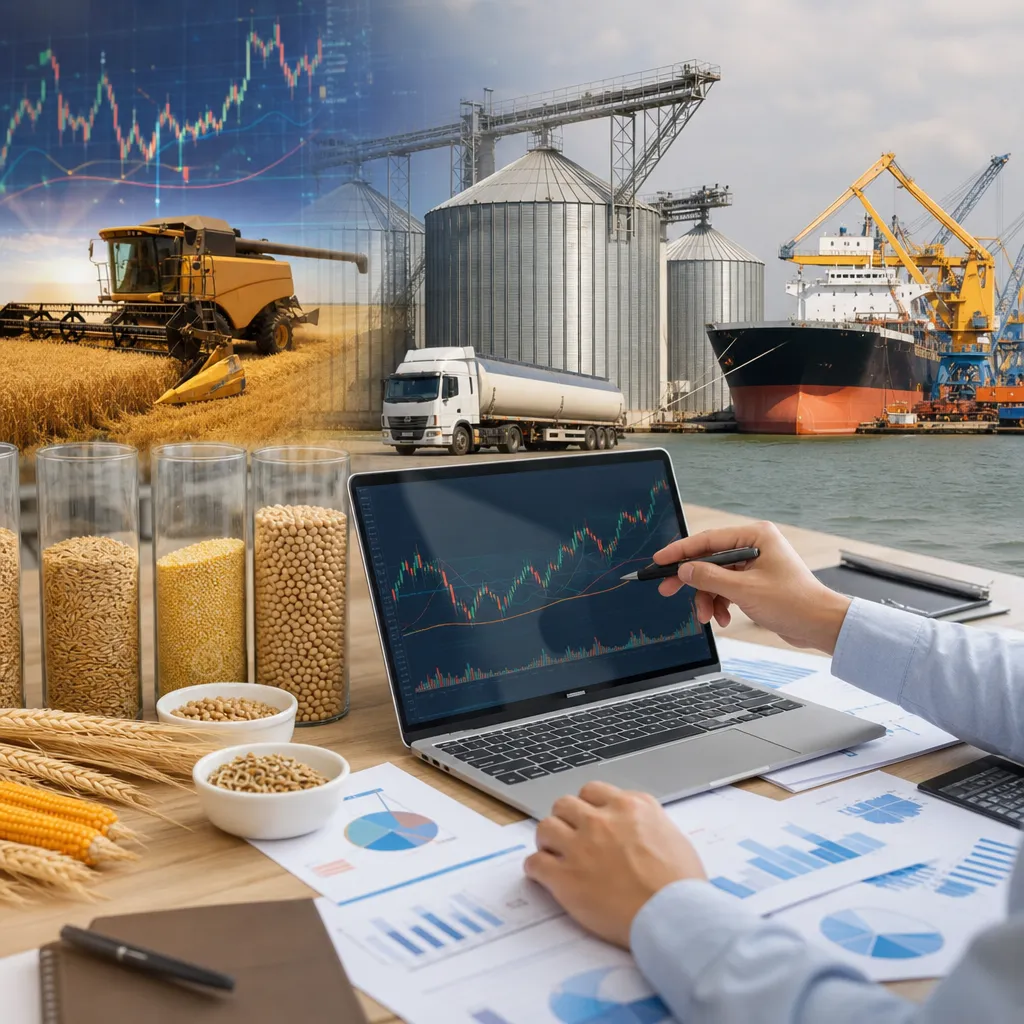
Grain price forecasting is the process of estimating how wheat, corn, soybeans, rice, barley, oats, rye, sorghum, canola, rapeseed, or other grain prices may change under different supply, demand, and market conditions. In practice, good forecasting does not produce certainty; it produces scenarios, probabilities, and risk ranges that help farmers, merchants, processors, exporters, and traders make better decisions. The most reliable methods combine futures market signals, local cash market information, crop and weather data, trade flows, and storage economics. The key practical point is that a forecast must always distinguish between exchange-traded futures prices and the local cash price actually paid at an elevator, processor, mill, or export point.
A farmer deciding whether to sell stored corn, a feed mill covering wheat needs, and a trader hedging soybean exposure may all use forecasting, but they use different price references and tools. Futures may be quoted at CME Group or another exchange, while the physical transaction may happen through a cooperative, elevator, grain merchant, crusher, exporter, or feed buyer. A useful forecast therefore starts by identifying which market is being forecast: futures, basis, delivered cash price, export parity, import parity, or a specific local bid. Without that step, many grain forecasts are accurate in theory but unusable in the real market.
What grain price forecasting really measures
There is no single “grain price.” A Chicago corn futures quote, a river terminal soybean bid, a feed wheat offer delivered to a mill, and FOB export barley loading at port are related but not identical prices. Forecasting methods differ depending on whether the goal is to estimate a benchmark exchange price or a local physical market price.
In most commercial grain analysis, the price received or paid is often broken into two parts:
- Futures price: the standardized benchmark traded on a regulated commodity exchange.
- Basis: the local adjustment, positive or negative, reflecting freight, storage, quality, handling, local supply, local demand, and logistics.
For example, corn may be hedged against a futures contract, but the grain sold physically to an elevator will be priced as futures plus or minus basis. That is why a forecast for farmers or buyers usually needs both a futures outlook and a basis outlook.
| Market element | What it measures | Where it is usually checked | Who uses it |
|---|---|---|---|
| Futures price | Exchange benchmark for a standard contract month, grade, and delivery specification | Commodity exchange data, broker platform, market data service | Traders, hedgers, analysts, merchants |
| Cash bid | Actual local buying price at a named delivery point | Elevator, cooperative, processor, merchant, local bid sheet | Farmers, local buyers, truckers |
| Basis | Difference between local cash and futures | Bid sheets, merchandising systems, broker or advisory services | Merchants, elevators, hedgers, producers |
| Delivered physical price | Price including freight to a mill, feedlot, plant, or port | Negotiated contract, merchant offer, processor tender | Processors, importers, end users |
Core forecasting methods used in grain markets
Most professional grain forecasts use a combination of methods rather than one model. Each method has strengths and blind spots.
Fundamental supply-and-demand analysis
This is the most common method in agricultural markets. Analysts estimate planted area, harvested area, yield, production, beginning stocks, imports, exports, feed use, crush or processing demand, and ending stocks. The most important output is often the stocks-to-use ratio, which compares available inventory with demand. Tight stocks generally increase price sensitivity to weather or logistics shocks, while burdensome stocks can cap rallies.
Where to get the data: USDA reports are widely used for global grains and oilseeds, especially WASDE, Crop Production, Grain Stocks, Crop Progress, and Export Sales. Outside the United States, analysts also use national agriculture ministries, statistical agencies, customs trade data, and FAO for broader context. Exporters and importers may also track port lineups, inspections, and vessel activity through commercial shipping services.
Weather and yield modeling
Weather is one of the fastest-moving grain price drivers. Forecasting models may track rainfall, temperature, soil moisture, drought intensity, planting pace, crop condition, frost risk, excessive heat during pollination, and harvest disruptions. For crops such as corn and soybeans, short periods of weather stress in key producing regions can alter yield expectations sharply.
How it works in practice: analysts compare current weather with crop development stage and historical analogs. They often use satellite vegetation data, precipitation maps, and field reports. Weather by itself does not determine price; it matters because it changes yield expectations relative to what the market already priced in.
Technical and price-pattern analysis
Technical methods use charts, moving averages, momentum, volume, volatility, and support or resistance zones. These methods are more common in futures trading than in farm merchandising, but they can still be useful for timing sales or hedge placement. Technical analysis is strongest as a market-behavior tool, not as a substitute for balance-sheet analysis.
Basis and local cash forecasting
This is often the most practical method for physical grain decisions. Local basis depends on elevator capacity, nearby supply, processor demand, rail and truck availability, river conditions, export congestion, and storage pressure at harvest. A perfectly correct futures forecast can still be commercially disappointing if local basis weakens.
Farmers and merchandisers usually check basis directly through local elevator and processor bids, cooperative offers, and merchant bid sheets. In some regions, official agricultural market reporting services publish regional cash prices, terminal prices, or basis summaries.
How futures markets contribute to grain forecasts
Exchange-traded futures provide transparent benchmark pricing and the market’s current consensus about nearby and forward value. Major grain and oilseed futures are commonly accessed through regulated exchanges and brokerage accounts rather than through physical grain dealers. For many internationally followed contracts, CME Group is a primary reference point.
Futures markets help forecasters in several ways:
- Forward curve structure: whether deferred contracts trade above or below nearby months can signal storage incentives, tight nearby supply, or bearish carry.
- Price discovery: futures absorb public information quickly, including crop reports, export data, and macroeconomic news.
- Hedging reference: elevators, processors, and exporters often hedge physical positions against futures.
- Options implied volatility: options markets reveal how much uncertainty the market is pricing.
However, futures are not the same as buying or selling physical grain. To trade futures, a user normally needs a futures broker and a margin account. Contracts are standardized, marked to market daily, and involve leverage. Most participants close or roll positions before delivery. A farmer selling wheat to a local cooperative is entering a physical transaction; a speculator buying a wheat futures contract is taking a financial position. The two markets connect through hedging and basis, but they are not interchangeable.
| Method | Best use | Main limitation |
|---|---|---|
| Supply-and-demand balance sheets | Medium-term price direction and crop-year outlook | Sensitive to revisions in yield, stocks, and trade data |
| Weather and yield models | Short-term production risk during the growing season | Weather forecasts change quickly and impacts depend on crop stage |
| Technical analysis | Trade timing and market sentiment | Can miss major fundamental shifts |
| Basis analysis | Local selling, buying, and hedge-to-arrive decisions | Highly regional and less transparent than exchange prices |
| Statistical or econometric models | Scenario analysis and historical relationships | Relationships can break during policy or logistics shocks |
Where analysts and market participants get forecasting inputs
Reliable forecasting starts with reliable inputs. Public data and regulated market data are usually the foundation, while commercial services may add speed, local detail, and analytics.
Official reports
- USDA WASDE: global and U.S. supply-demand balance sheets for major grains and oilseeds.
- USDA Crop Progress: planting, emergence, crop condition, and harvest pace, mainly valuable during the season.
- USDA Export Sales: weekly export commitments, useful for demand tracking.
- USDA Grain Stocks and Crop Production: inventory and production estimates that can reset market expectations.
- CFTC Commitments of Traders: positioning data in futures and options, used to gauge speculative length or short covering potential.
- FAO and national agencies: broader international production and food market context.
Exchange and broker data
Exchanges publish contract specifications, settlement data, volume, open interest, and options information. Brokers and market-data vendors distribute this in trading platforms and analytics systems. Traders use this to monitor spreads, carry, volatility, and contract liquidity.
Physical market information
Cash bid data usually comes from elevators, cooperatives, grain merchants, crushers, feed mills, ethanol plants, flour mills, and exporters. This may exist online through bid sheets, mobile apps, email lists, merchandising portals, or direct communication with local buyers. In some regions, public market reporting services collect terminal and regional cash price information, but many physical transactions remain negotiated and market-specific.
How to build a practical grain price forecast
A useful forecast should be built in layers. This approach works better than trying to predict one exact number.
- Define the market to forecast. Decide whether you need a futures outlook, a farmgate cash bid, a delivered processor price, or an export value.
- Set the time horizon. Intraday trading, harvest pricing, post-harvest storage, and new-crop marketing require different methods.
- Build the balance sheet view. Review acreage, yield risk, stocks, exports, imports, and use.
- Add weather and seasonal risk. Focus on key crop stages and major producing regions.
- Check the futures curve. Look for carry, inverses, and options volatility.
- Estimate local basis. Use elevator bids, processor bids, freight conditions, and storage pressure.
- Create scenarios. For example, normal yield, weather-reduced yield, strong export demand, or weak macro demand.
- Translate the forecast into an action. Cash sale, hedge, minimum-price strategy, storage, basis contract, or delayed pricing.
This process can be done with spreadsheets, farm management software, grain merchandising software, market terminals, or broker analytics. Larger merchants and processors often use integrated risk systems combining futures exposure, basis books, freight, and customer contracts. Farmers may use a simpler mix of elevator bids, advisory commentaries, exchange data, and spreadsheets.
Using forecasts in physical grain marketing
Forecasting is most valuable when linked to an actual transaction. In the physical market, grain may be sold through a local elevator, cooperative, merchant, processor, feed company, exporter, or broker arranging a direct trade. The final price depends on more than market direction.
Important commercial variables include:
- Delivery point: on-farm pickup, elevator delivery, processor delivery, or port shipment.
- Quality and grade: protein, moisture, test weight, foreign material, damage, oil content, or mycotoxin risk depending on crop.
- Freight: truck, rail, barge, or vessel costs can materially change net value.
- Storage: carrying grain adds financing, shrink, handling, and quality risk.
- Payment terms: timing and counterparty reliability matter, especially in private contracts.
- Contract type: spot cash, forward contract, basis contract, hedge-to-arrive, minimum-price, or processor program.
Forecasting local basis is especially important around harvest, when grain movement pressure can weaken nearby cash bids even if futures remain relatively firm. Conversely, basis may strengthen later if storage is tight, local users need coverage, or freight routes improve.
Common mistakes in grain price forecasting
The most common error is confusing a quoted futures price with a realizable cash price. Local basis, freight, and quality discounts can make the actual farmgate or delivered price very different.
Other frequent mistakes include:
- Using one report as a complete forecast instead of tracking revisions over time.
- Ignoring currency effects in export-oriented markets.
- Assuming historical basis patterns will repeat despite changes in logistics or local demand.
- Relying on weather headlines without considering crop stage and market expectations.
- Using leveraged futures positions as if they were low-risk inventory hedges.
- Failing to connect a forecast to storage cost, interest cost, and downside risk.
A strong forecast is not judged only by direction. It is judged by whether it improves merchandising, hedging, inventory, or procurement decisions after accounting for costs and execution.
Best use cases for different market participants
Different users need different forecasting methods and data depth.
- Farmers: usually need local cash and basis forecasts, seasonal tendencies, storage economics, and hedge decision support.
- Elevators and cooperatives: need basis management, hedge timing, customer flow analysis, and logistics planning.
- Processors and feed manufacturers: need procurement scenarios, delivered-cost analysis, and quality-sensitive local market intelligence.
- Exporters and merchants: need flat price, basis, freight, spreads, currency, and trade policy analysis.
- Speculative traders: focus more on futures, options, macro flows, technicals, and report-driven volatility.
The best forecasting setup is therefore the one aligned with the user’s actual commercial exposure, not the one with the most complex model.
Where can I check grain prices used in forecasts?
Futures benchmark prices are commonly checked through exchange data, broker platforms, and market-data services. Local cash bids are normally checked through grain elevators, cooperatives, processors, feed mills, crushers, merchants, and regional market reporting systems. For practical selling decisions, local bids matter more than a futures quote alone.
What is the difference between a grain price forecast and a basis forecast?
A grain price forecast often refers to the benchmark futures market. A basis forecast estimates how local cash prices will differ from futures because of freight, storage, local supply, local demand, and quality conditions. Physical sellers and buyers usually need both.
Can I use futures prices to predict what my local elevator will pay?
Only partly. Futures provide the benchmark, but the elevator bid also reflects basis, grade discounts, moisture, handling charges, and delivery timing. The same futures market can produce very different local prices in different regions.
Where does grain forecasting happen in practice?
It happens in many places: farm offices, cooperative merchandising desks, grain merchant trading floors, processor procurement teams, brokerage platforms, advisory firms, and analyst desks. The forecast may be built with public reports, spreadsheets, market terminals, and direct physical bid information.
Are statistical models enough on their own?
Usually no. Econometric or machine-learning models can help organize historical relationships, but grain prices are often moved by weather shocks, policy changes, logistics disruptions, and revisions to crop estimates. Most experienced analysts combine quantitative models with current fundamental and physical market intelligence.
How do storage decisions affect a grain price forecast?
Storage changes the decision from today’s cash price to an expected later cash price minus carrying costs. A higher future bid is not automatically better if storage, shrink, interest, and quality risk exceed the gain. The futures carry and likely basis movement should both be considered.
Do I need a broker to trade grain futures?
Yes, futures trading normally requires access through a regulated futures broker and a margin account. That is different from selling physical grain to an elevator or merchant. A broker platform is for financial contracts; an elevator or processor is for actual grain movement and delivery.
Which reports matter most for forecasting wheat, corn, and soybeans?
Commonly used reports include USDA WASDE, Crop Progress, Export Sales, Grain Stocks, and Crop Production, along with exchange data and CFTC positioning reports. For non-U.S. regions, national agriculture ministries, official statistics, and customs trade data are also important.
Sources
- USDA World Agricultural Supply and Demand Estimates
- CME Group contract specifications and market data
- U.S. Commodity Futures Trading Commission Commitments of Traders