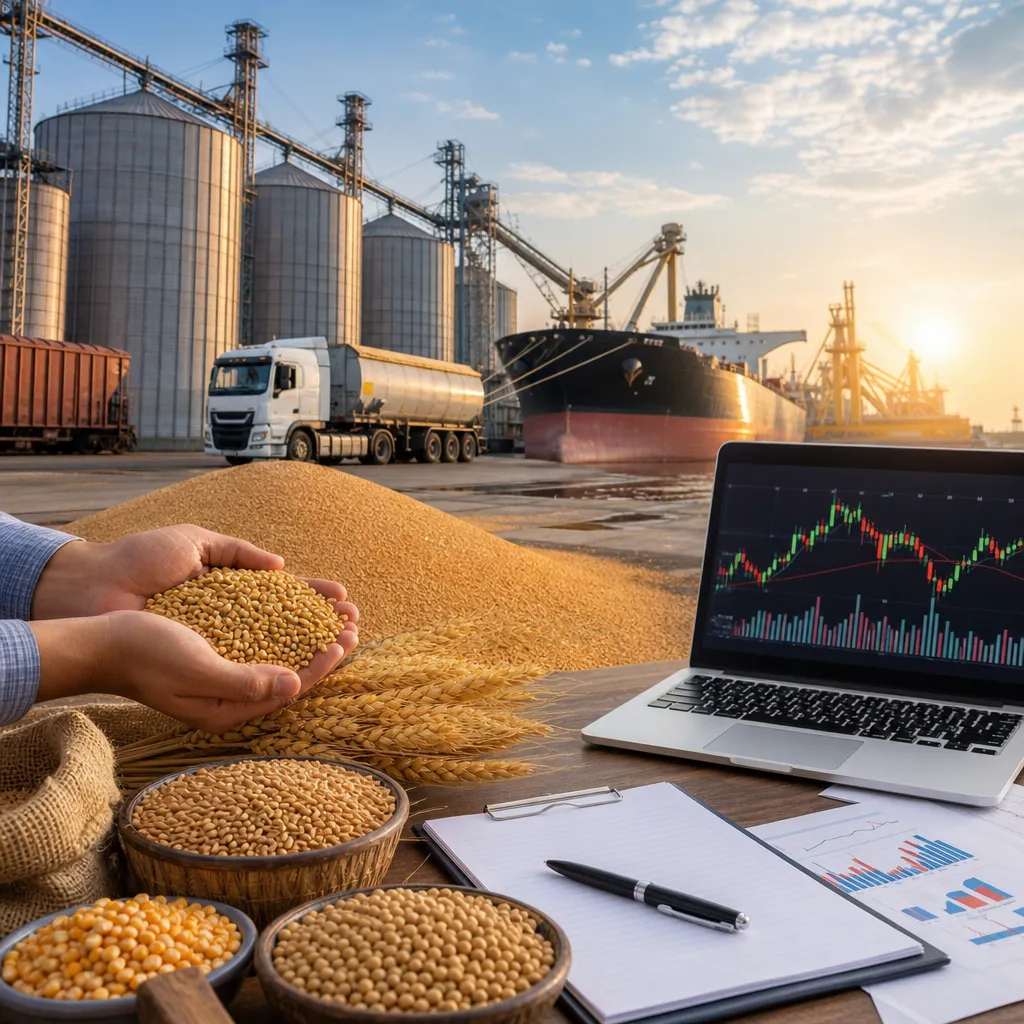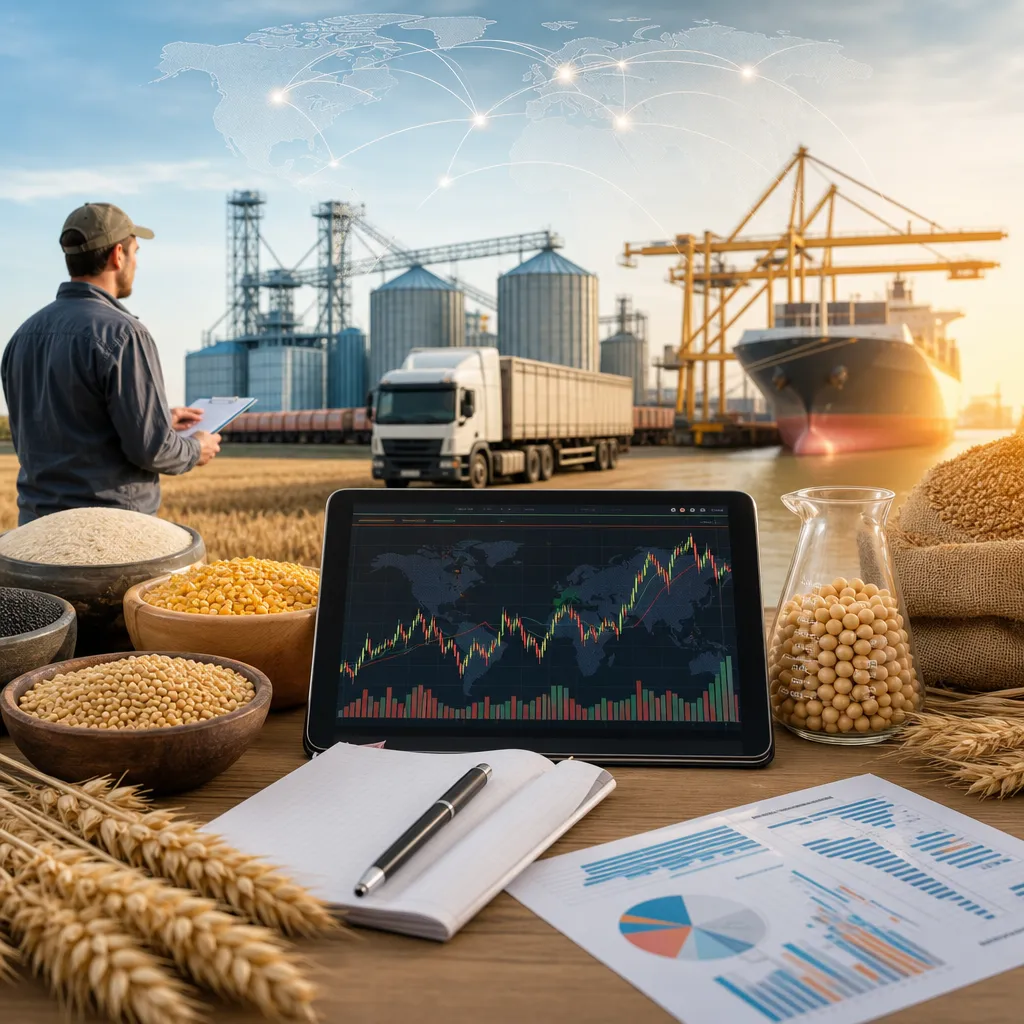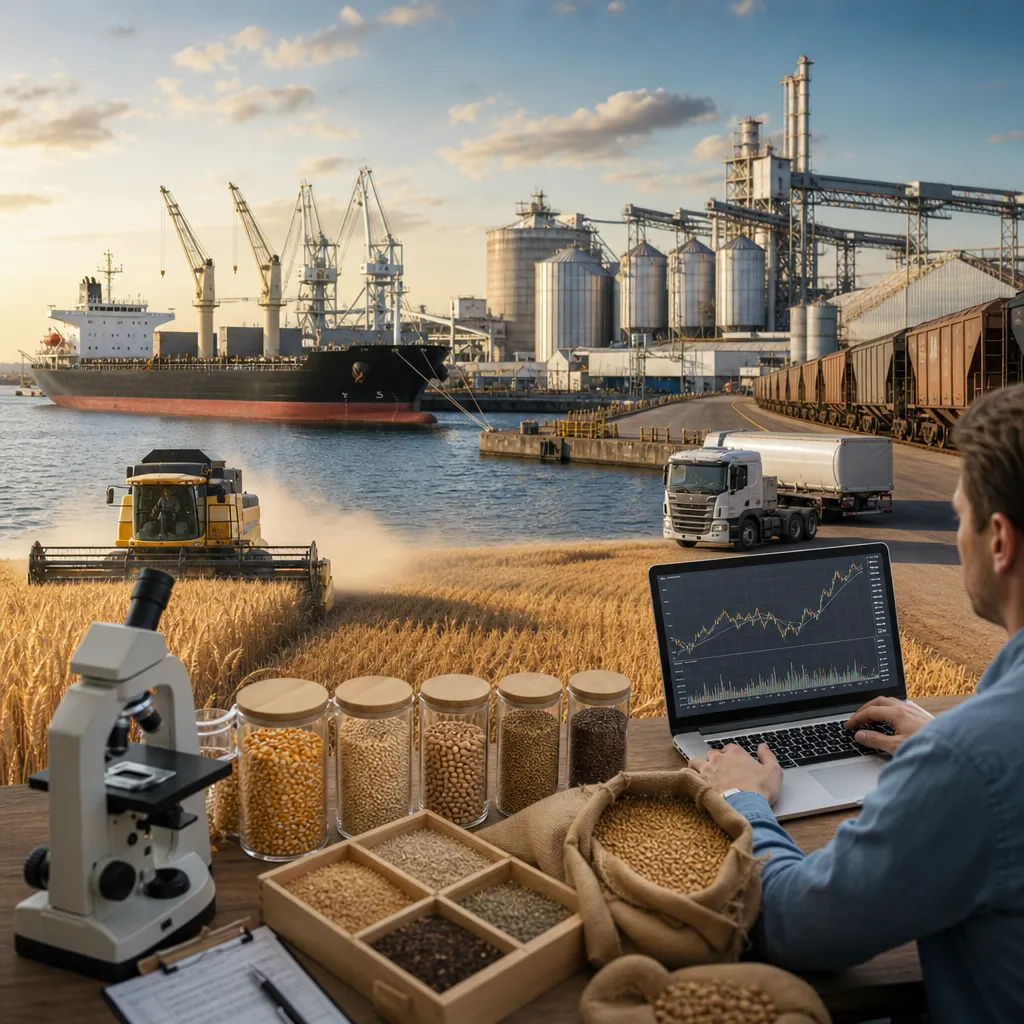
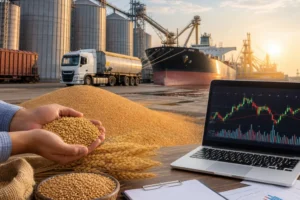
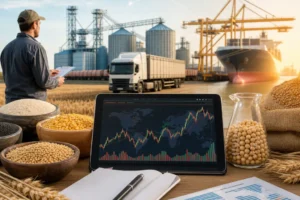
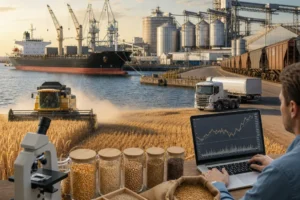


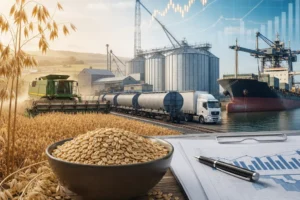
Grain prices in 2030 will likely be shaped less by any single headline forecast and more by the interaction of weather risk, stocks, trade policy, energy markets, biofuels, currencies, and logistics. For wheat, corn, soybeans, rice, barley, and oilseeds, the most practical way to think about a 2030 forecast is through scenarios: a tight-supply world, a balanced market, or a surplus cycle. Readers should treat any long-range price target with caution, because grain markets react quickly to changing acreage, yield, exports, freight, and government policy. The best way to prepare for 2030 is to understand where prices are formed, where they are quoted, and how physical grain values differ from futures benchmarks.
For most market participants, “grain price forecast 2030” really means two different things: the outlook for benchmark exchange prices and the outlook for local cash prices received or paid in a specific region. Those are related, but they are not the same. A farmer selling to a local elevator, a feed mill buying corn, or an importer sourcing wheat cargoes will all face basis, freight, quality, and timing differences that can move real-world prices away from futures quotes.
What a Grain Price Forecast for 2030 Actually Means
A long-term grain forecast is not a single number. It is a view on how supply and demand may evolve by 2030 across major crops and regions. Analysts normally look at global and domestic balances for wheat, corn, soybeans, rice, barley, sorghum, canola, rapeseed, and sunflower seed, then compare expected consumption growth against production capacity and stocks.
In practice, grain prices are formed in several layers:
- Futures markets provide benchmark prices for standardized contracts.
- Cash markets reflect local bids from elevators, cooperatives, merchants, mills, crushers, feed manufacturers, and exporters.
- Export markets price grain delivered to ports or import destinations, often influenced by freight and trade terms.
- OTC contracts may be negotiated privately between commercial participants for specific quality, delivery, and timing.
By 2030, the most important question is not whether prices will be “high” or “low” in absolute terms, but whether the market will trade in a structurally tighter or looser balance sheet compared with recent years.
Main Drivers of Grain Prices Through 2030
Several variables matter consistently across grain markets. Some affect all crops, while others are crop-specific.
| Driver | Likely Effect on 2030 Prices | How It Works in Practice |
|---|---|---|
| Weather and yield variability | Higher volatility, especially if stocks are tight | Drought, heat, flooding, or planting delays can reduce yields and quickly tighten supply. |
| Acreage competition | Shifts price relationships between crops | Farmers compare expected returns for corn, soybeans, wheat, canola, and other crops before planting. |
| Stocks-to-use | Low stocks usually support prices | When carryout is thin relative to demand, markets react more strongly to supply shocks. |
| Exports and imports | Can tighten or loosen regional markets | Large import demand or export restrictions can rapidly change trade flows and local premiums. |
| Energy and biofuels | Important for corn, vegetable oils, and oilseeds | Ethanol and biodiesel policy can raise industrial demand for corn, soy oil, rapeseed oil, and similar products. |
| Currencies and freight | Affects export competitiveness and local cash values | A stronger or weaker domestic currency changes the local value of internationally traded grain. |
For wheat, the key long-term issue is whether major exporting regions can maintain stable production under more frequent weather stress. For corn and soybeans, feed demand, biofuel policy, and acreage competition are central. For rice, domestic government policy and trade restrictions often matter more than futures-market signals. For canola and rapeseed, vegetable oil demand and crush margins can be as important as seed production itself.
Three Practical Price Scenarios for 2030
A sensible forecast uses scenarios rather than certainty.
Tight-supply scenario
Prices would stay structurally firm if weather-related yield losses become more frequent, global stocks remain low, and demand from feed, food, and biofuels continues to grow. In this environment, futures curves may show frequent risk premiums, and local cash markets near processors or export terminals can strengthen sharply. Basis can improve in deficit regions even if futures are only moderately higher.
Balanced-market scenario
This is the most neutral outlook. Production growth keeps up with demand, stocks do not become burdensome, and trade flows remain open. In that case, prices may remain volatile seasonally but not trend strongly upward or downward over the full period to 2030. Farmers and commercial users would likely focus more on basis management, storage returns, and hedging discipline than on betting on a major structural rally.
Surplus-cycle scenario
Prices could weaken if several large crops rebuild stocks, acreage expands, logistics improve, and demand growth disappoints. This can happen when high prices encourage production and good weather follows. In such a cycle, nearby cash prices often come under pressure first in inland markets with limited storage or weak local demand. Futures may decline, but the local impact depends heavily on basis and freight.
Where Grain Prices Are Quoted and How to Check Them
Anyone working with a 2030 grain outlook should know where benchmark and physical prices are actually observed.
| Market Type | Where It Exists | What It Tells You | Who Uses It |
|---|---|---|---|
| Futures | Regulated exchanges such as CME Group and other commodity exchanges | Benchmark price for standardized contracts by delivery month | Traders, hedgers, funds, elevators, processors, exporters |
| Local cash bids | Elevators, cooperatives, merchants, mills, crushers, feed companies | Actual local buy or sell price subject to quality, basis, and delivery terms | Farmers, livestock producers, local buyers |
| Export and port markets | Export merchants, port terminals, trade houses, tenders | Value of grain at export location or delivered destination | Exporters, importers, shipping and procurement teams |
| Government and statistical reports | USDA, FAO, national agriculture ministries, statistical offices | Supply, demand, acreage, yield, stocks, trade estimates | Analysts, farmers, traders, policy teams |
Futures prices are usually checked on exchange websites, through futures brokers, or via market-data vendors. For U.S. benchmark grain contracts, CME Group is central. These quotes are useful for direction, hedging, and relative value between delivery months, but they are not the same as a farmgate or delivered physical grain price.
Local cash prices are normally checked through elevator bid sheets, cooperative websites, grain merchant bid pages, local phone quotes, or direct buyer relationships. In some regions, government or industry market reporting services also publish cash-price surveys. Those prices usually reflect basis, grade, moisture, protein, test weight, dockage, and delivery point.
Export prices are found through trade reporting services, merchant indications, tender results, customs data, and commercial intelligence platforms. These are important for countries that are major exporters or importers, but access may be less transparent than exchange futures.
How Futures, Basis, and Local Cash Prices Connect
The most common forecasting mistake is assuming that a futures quote equals the physical grain price a farmer receives. It does not.
The usual relationship is:
Local cash price = futures price + or – basis
Basis is the local adjustment for freight, handling, storage, regional supply and demand, processor needs, export pull, and grain quality. A corn bid near a feed deficit area may have a much stronger basis than a bid in a production-surplus region during harvest. Wheat with higher protein may command premiums, while damaged grain may be discounted regardless of what futures did that day.
By 2030, basis may become even more important because logistics and regional weather disruptions could create larger local dislocations. For example:
- A large crop with congested rail or port capacity can pressure local basis even if futures remain stable.
- A short crop near a mill, crusher, or feed plant can strengthen basis sharply.
- Changes in export corridor reliability can widen the gap between inland and port values.
Anyone forecasting real grain revenues or procurement costs for 2030 should model both the benchmark price and the likely basis environment.
Where Farmers, Buyers, and Traders Use the Market
Different participants use different parts of the grain market.
Farmers and grain producers
They usually sell physical grain to local elevators, cooperatives, merchants, feed mills, ethanol plants, crushers, or exporters. Sales may be spot, forward cash, basis-only, delayed-price, hedge-to-arrive, or storage-linked, depending on local practice and buyer offerings. The seller should check grade standards, moisture limits, delivery windows, and payment timing.
Processors and feed manufacturers
These buyers often procure grain through direct contracts, merchant relationships, local tenders, or spot bids. They may hedge futures exposure separately while negotiating physical quality and arrival terms with suppliers.
Exporters and importers
These firms work in port markets, vessel logistics, customs documentation, and international trade terms. Physical values can depend on Incoterms, inspection rules, freight markets, and destination specifications. A futures account alone does not give access to this trade flow.
Financial traders and hedgers
They operate through regulated futures exchanges using a futures broker. This requires a brokerage account, margin funding, and an understanding of leverage, contract size, expiry, and delivery rules. Most financial traders close or roll positions before delivery. Buying a futures contract is not the same as buying truckloads of grain.
How to Build a Practical 2030 Grain Forecast
A useful forecast combines public data, local market intelligence, and scenario planning.
- Start with official balance sheets. USDA WASDE is widely used for global and U.S. supply-demand estimates. National ministries and statistical agencies are important for other producing and consuming regions.
- Track acreage and crop conditions. Planting intentions, crop progress, and harvest updates help estimate output before final production numbers are known.
- Watch trade flows. Export sales, customs statistics, import tenders, and port lineups show whether demand is strengthening or weakening.
- Monitor weather and soil moisture. Weather is often the biggest cause of forecast changes during the growing season.
- Add currency, energy, and freight inputs. These shape competitiveness and delivered cost.
- Model basis separately. Use local elevator history, processor demand, storage pressure, and transport constraints.
For online analysis, readers commonly use exchange data pages, broker platforms, commercial charting and analytics software, and government report portals. For physical-market analysis, they also need conversations with local elevators, merchants, processors, warehouse operators, or transport providers, because those details are often not fully visible in public data.
Risks, Costs, and Limitations of Any 2030 Forecast
The biggest limitation is that long-range forecasts become less reliable the further they extend. Weather shocks, policy changes, war, input-cost swings, and infrastructure disruptions can overturn a carefully reasoned outlook very quickly.
There are also market-structure risks:
- Basis risk: a hedge may offset futures movement but not a change in local basis.
- Margin risk: futures hedges require cash to meet margin calls even if the physical position is sound.
- Quality risk: a crop may exist in volume but not in the grade a buyer needs.
- Storage risk: on-farm or commercial storage can improve timing but adds cost, shrink, quality-management, and financing issues.
- Counterparty risk: forward contracts and OTC deals depend on the reliability of the buyer or seller.
For that reason, many commercial users do not rely on a single 2030 price view. They update assumptions regularly as crop reports, weather, and trade conditions change.
What a Sensible 2030 Outlook Looks Like
The most defensible grain price forecast for 2030 is that volatility is likely to remain structurally important. Global demand for feed, food, and vegetable oils is unlikely to disappear, but supply growth will depend on yields, acreage, technology, and climate stability. That argues for recurring price swings rather than a permanently one-way market.
For farmers, the practical implication is to focus on marketing flexibility, storage discipline, and basis awareness rather than waiting for a single “2030 number.” For buyers, the priority is diversified procurement, quality control, and hedging policy. For traders and analysts, the best forecast process is one that combines public benchmark data with region-specific physical intelligence.
Where can I check grain prices for wheat, corn, and soybeans?
Benchmark futures prices are usually checked on exchange websites such as CME Group, through futures brokers, or via market-data services. Local cash bids are usually found on elevator, cooperative, merchant, mill, crusher, or feed-company bid sheets. The local cash bid is the more relevant number for an actual physical sale or purchase.
Is a grain futures price the same as the price paid by a local elevator?
No. A futures price is an exchange-traded benchmark for a standardized contract. A local elevator bid includes basis, freight, location, quality, moisture, and timing adjustments. The price a farmer receives can be above or below the futures benchmark depending on those factors.
Where does physical grain trading happen?
Physical grain trading usually happens through elevators, cooperatives, grain merchants, processors, mills, crushers, feed manufacturers, exporters, and importers. Transactions may be negotiated directly, through a broker, or through a standing bid program. Delivery point, grade, and payment terms are critical.
How can someone hedge grain price risk to 2030?
Most hedging is done with futures and options through a regulated exchange and a licensed futures broker. Commercial firms may also use OTC contracts where permitted. Hedging reduces price exposure but does not remove basis risk, margin risk, or quality risk.
Which reports matter most for long-term grain forecasting?
USDA WASDE is one of the core references for supply and demand. Crop Progress, acreage reports, export sales, and stocks reports are also widely used. FAO and national agriculture ministries help with global and regional context outside the United States.
Can I buy physical grain online the same way I trade futures?
Usually not in the same way. Futures trading takes place on a regulated exchange through a brokerage account. Physical grain purchases are normally arranged with an elevator, merchant, processor, cooperative, or exporter, and require agreement on quality, quantity, delivery, and payment terms.
What should I check before storing grain in expectation of higher prices?
Check storage cost, financing cost, aeration and quality-management needs, expected basis improvement, shrink risk, and the spread between nearby and deferred market periods. Storage only makes sense when the expected improvement in net sale value exceeds the full cost and risk of holding inventory.
Why are 2030 grain forecasts so uncertain?
Because grain prices depend on weather, policy, trade flows, energy, currencies, freight, and changes in planted area and yield. Those variables can shift sharply in a single growing season, which makes any long-range target less reliable than a regularly updated scenario-based outlook.
Sources
- USDA World Agricultural Supply and Demand Estimates
- CME Group agricultural futures contract information and market data
- FAO food and agricultural market analysis publications