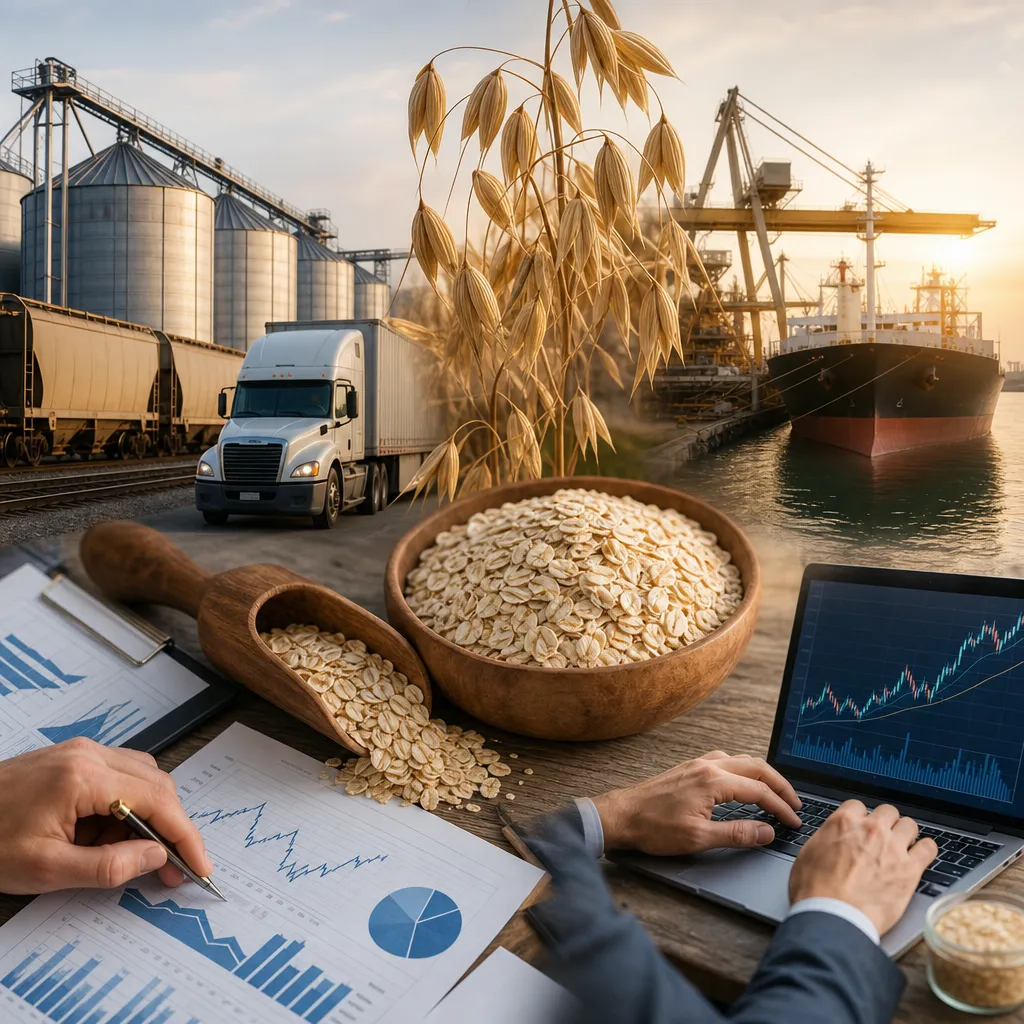



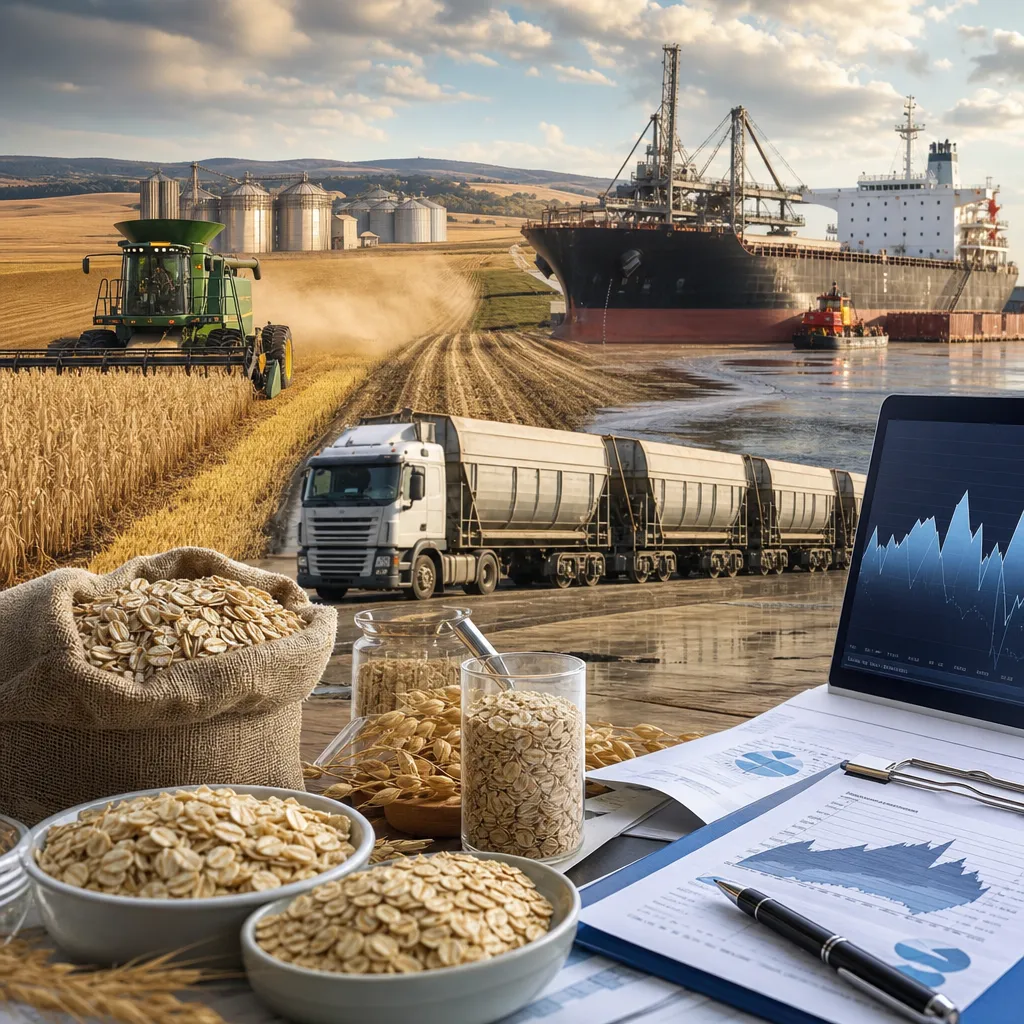
The United States oat market is a relatively small grain market compared with corn, soybeans, and wheat, but it remains important for food manufacturers, livestock feeders, grain handlers, and cross-border traders. In the US, oats are produced domestically, imported in meaningful quantities, processed into food and feed products, and priced through a combination of futures, local cash bids, freight, quality, and regional supply-demand conditions. Anyone following US oat supply and demand needs to understand two linked markets: the national balance sheet reported by USDA and the physical cash market that operates through elevators, mills, feed buyers, and merchants. Because oats are also traded on a futures exchange, Chicago futures can influence price discovery, but a futures quote is not the same thing as a local farm or delivered mill price.
What “US oat supply and demand” means
In practice, US oat supply and demand refers to the national balance between available oat supplies and total use within the United States. Supply usually includes beginning stocks, current crop production, and imports. Demand usually includes food use, feed use, seed, exports, and ending stocks.
This matters because the US is not just a producer of oats; it is also an importer, especially from Canada. That means the US oat market is influenced by both domestic crop conditions and Canadian supply. A tight US crop does not automatically create a shortage if imports are available at competitive values, while a large domestic crop does not guarantee weak prices if milling demand is firm or logistics are constrained.
For market participants, the phrase can mean different things depending on use:
- Farmers and country elevators watch local bids, basis, and harvest movement.
- Millers and food companies focus on quality, protein, test weight, origin, and delivered cost.
- Feed buyers compare oats with corn, barley, hay, and other feed ingredients.
- Traders and hedgers follow USDA balance sheets, futures spreads, cash basis, and import flows.
Where the US oat market operates
The market is national, but it is not evenly distributed across the country. Oats are grown mainly in northern US regions where climate and rotations suit the crop. The most relevant physical market areas are typically the Upper Midwest and Northern Plains, where production, storage, and first-point merchandising are concentrated.
The United States prices oats in US dollars. In futures markets, oats are commonly quoted in cents per bushel. In physical trade, the unit can vary depending on the buyer and contract, but bushels and short tons are common in domestic contexts, while broader trade analysis may also refer to metric tons.
The financial benchmark most market participants watch is CBOT oat futures, listed by CME Group. The exchange benchmark matters because it helps form hedging values and reference pricing, even though actual physical oats are bought and sold through cash contracts away from the exchange.
| Market element | Where it operates | Why it matters |
|---|---|---|
| National supply and demand | USDA balance sheets and market analysis | Shows broad production, imports, use, exports, and stocks |
| Futures market | CBOT on CME Group | Used for price discovery and hedging |
| Cash market | Elevators, cooperatives, mills, merchants, feed buyers | Where physical oats are actually bought and sold |
| Import trade | Cross-border North American grain trade, especially with Canada | Can materially affect US availability and price relationships |
How US oat prices are formed
US oat prices are formed through a layered process. The first layer is the exchange benchmark: CBOT oat futures provide a transparent reference value for the market. The second layer is basis, which is the local cash difference versus futures. The third layer includes quality, timing, freight, storage, competition among buyers, and the relative value of substitute grains or feed ingredients.
It is important to distinguish the major price types:
- Futures price: the exchange-traded benchmark for a specific contract month.
- Cash bid: what a local elevator, cooperative, merchant, or processor is willing to pay for physical oats at a specific location.
- Delivered price: the value paid with freight to a named destination such as a mill or feed plant included.
- Export bid: a price tied to grain assembled for shipment abroad or to a border/export channel.
- FOB price: free on board at a loading point, generally used in export trade.
- CIF price: cost, insurance, and freight to the arrival point, more relevant to import landed cost.
Local US oat prices can trade above or below futures depending on nearby supply, transportation availability, processor demand, storage economics, and quality. A milling oat buyer may pay a premium for oats meeting tighter specifications, while feed buyers may value oats mainly against competing energy feeds. In some areas, cross-border freight and Canadian price relationships can be just as important as the US futures board.
US oat supply: production, imports, and stocks
US oat supply starts with domestic production, but it does not end there. Compared with larger row crops, oats occupy a smaller share of US acreage, so weather problems or acreage shifts can have a noticeable effect on domestic availability. Spring conditions, planting progress, summer moisture, and harvest quality can all matter.
Imports are especially important in the US oat balance. Canada is a major external supplier to the US market, and Canadian oats often move into US food and feed channels. That makes the US market more integrated with North American supply than a simple domestic-only view would suggest.
Beginning and ending stocks also matter because they determine how much buffer the market has. When stocks are ample, short-term production losses may be easier to absorb. When stocks are tight, price sensitivity to weather, logistics, or stronger-than-expected milling demand can increase.
From a practical trading standpoint, supply analysis usually focuses on:
- US planted and harvested area
- Yield and final production
- Grade and milling quality
- Canadian supply and cross-border trade flows
- Carry-in and carryout stocks
- Rail and truck logistics in northern producing regions
US oat demand: food, feed, and trade
Demand for oats in the United States is more specialized than for corn. The most visible demand segment is food use, including oatmeal, cereals, snack ingredients, and other oat-based products. This demand can be relatively stable compared with feed grains, but buyers often require consistent quality and reliable logistics.
Feed demand can be more price-sensitive. Oats compete with other feed ingredients, and usage may rise or fall depending on relative values. If corn or other feeds become expensive, oats may find additional ration demand in certain segments. If oats are relatively expensive, feed demand can weaken.
Exports are part of the balance sheet too, but the US market is often discussed more in terms of domestic use plus import dependence than as a dominant global oat exporter. Because of this structure, domestic demand and North American trade flows can outweigh broader seaborne export dynamics that are more central in wheat or corn.
| Demand channel | How it behaves | Main pricing implication |
|---|---|---|
| Food and milling use | Usually quality-focused and relatively steady | Can support premiums for suitable quality and dependable delivery |
| Feed use | Sensitive to the price of corn and alternative feeds | Can swing with substitution economics |
| Imports | Influenced by Canadian availability and freight | Can cap or reinforce US cash values depending on landed cost |
| Exports | Smaller but still part of the balance | Can tighten supply if external demand improves |
Where to check US oat market information online
For reliable market information, readers should separate benchmark prices from cash market offers and separate official statistics from trade rumor.
The most practical official sources are:
- USDA: for US and world oat supply-demand data, crop reports, acreage, stocks, and trade information.
- CME Group: for CBOT oat futures contract information and market data access.
- USDA Agricultural Marketing Service: for some cash market reporting and grain transportation context where available.
For actual physical buying and selling, market participants also check:
- Local elevator and cooperative bid sheets
- Processor and mill procurement bids
- Merchants and grain trading firms
- Broker platforms or data vendors for futures and basis monitoring
If someone is looking for the “current US oat price,” the key question is which price. A CBOT oat futures price is not the same as a country elevator bid in Minnesota or a delivered mill bid in another state. Futures are standardized exchange values; cash bids are location-specific commercial offers.
How oats are physically bought and sold in the United States
Physical oats are normally traded through the commercial grain chain, not by clicking a futures screen. Farmers may sell to a local elevator, cooperative, merchant, feed buyer, or food-grade processor. Buyers may offer spot bids for immediate movement or forward contracts for future delivery.
Typical commercial steps include:
- Seller requests a bid for a given delivery period and location.
- Buyer states quality requirements, discount schedules, and delivery terms.
- Grain is delivered by truck or assembled through the elevator system.
- Weights, grades, and quality tests determine final settlement.
- Payment is made according to the contract terms.
In food-grade channels, contract terms can be stricter than in feed channels. Buyers may require specific quality characteristics and may reject or discount loads that do not meet standards. Counterparty strength, contract wording, and delivery timing all matter in practice.
Merchants and elevators may then move oats onward to mills, feed users, or other commercial destinations. Some participants hedge price exposure on the futures market while separately handling the physical grain. That is a normal commercial practice and does not mean the futures market itself is the place where most physical oats change hands.
How oats are traded or hedged with futures and options
CBOT oat futures are used mainly for price risk management and price discovery. A hedger such as an elevator, merchant, processor, or commercial buyer may use futures to offset the risk of price moves between the time physical grain is bought and the time it is sold or processed.
For example, a country buyer may purchase physical oats from farmers and sell futures to protect against a falling market. A processor concerned about rising prices may buy futures or use options, while still negotiating physical purchase contracts separately.
This is different from speculation. A trader using a broker account can gain financial exposure to oat prices without ever owning a truckload of grain. Futures require margin, are leveraged, and can involve basis risk because local cash prices do not always move one-for-one with the board.
So the distinction is essential:
- Physical market: ownership, delivery, quality, logistics, and payment.
- Futures/options market: financial hedge or trading exposure on an exchange.
Main drivers of the US oat market outlook
Any forecast for US oat supply and demand should be framed as scenarios, not certainty. The most important market drivers usually include acreage, yield, quality, Canadian supply, food demand, feed substitution, and logistics.
Key scenarios to watch include:
- Larger US crop scenario: better production can ease domestic tightness, but the price impact depends on quality and stocks.
- Smaller US crop scenario: cash markets may tighten, especially if imports are not easily increased.
- Strong Canadian supply scenario: imported oats can moderate US cash values.
- Firm food demand scenario: millers may support basis for qualified oats even if futures are soft.
- Higher competing feed grain prices: oats may gain feed demand support.
- Freight or logistics problems: local basis can strengthen even when futures do not.
Because oats are a smaller market, regional disruptions can matter more than in deeper, more liquid grain markets. That is why national balance sheets should always be read alongside local cash conditions.
Practical questions readers often ask
Where can I check the US oat price today?
Check CME Group for the benchmark CBOT oat futures price and compare it with local cash bids from elevators, cooperatives, merchants, or processors. The exact price depends on contract month, location, quality, and delivery period.
Is the CBOT oat futures price the same as the farm price?
No. Futures are a benchmark. A farm or elevator cash price differs because of basis, freight, local supply-demand conditions, storage, and quality adjustments.
What is the main benchmark for US oats?
The main exchange benchmark is CBOT oat futures through CME Group. For national supply and demand, USDA reports are the standard reference.
Does the US import a lot of oats?
The US oat market is meaningfully affected by imports, especially from Canada. That is a core reason why US oat prices cannot be analyzed only from domestic production.
How do farmers usually sell physical oats?
Most sell through local elevators, cooperatives, merchants, feed buyers, or processors using spot or forward contracts. The details depend on location, quality, and intended end use.
Can an individual trader buy oats online through futures?
Yes, through a regulated broker offering access to CBOT futures, but that is financial trading, not the same as participating in the physical grain trade. Futures involve leverage, margin, and expiration risk.
Why do local oat prices sometimes rise even when futures do not?
Because local cash markets respond to basis factors such as freight, regional shortages, buyer competition, and quality needs. A strong milling bid in one region can lift local cash prices without a matching move in the futures board.
Which reports matter most for US oat supply and demand?
USDA reports are the main starting point, especially national balance sheet, crop production, acreage, stocks, and trade data. Market participants then compare those figures with local bids and commercial conditions.
Sources
- USDA World Agricultural Supply and Demand Estimates
- USDA National Agricultural Statistics Service
- CME Group