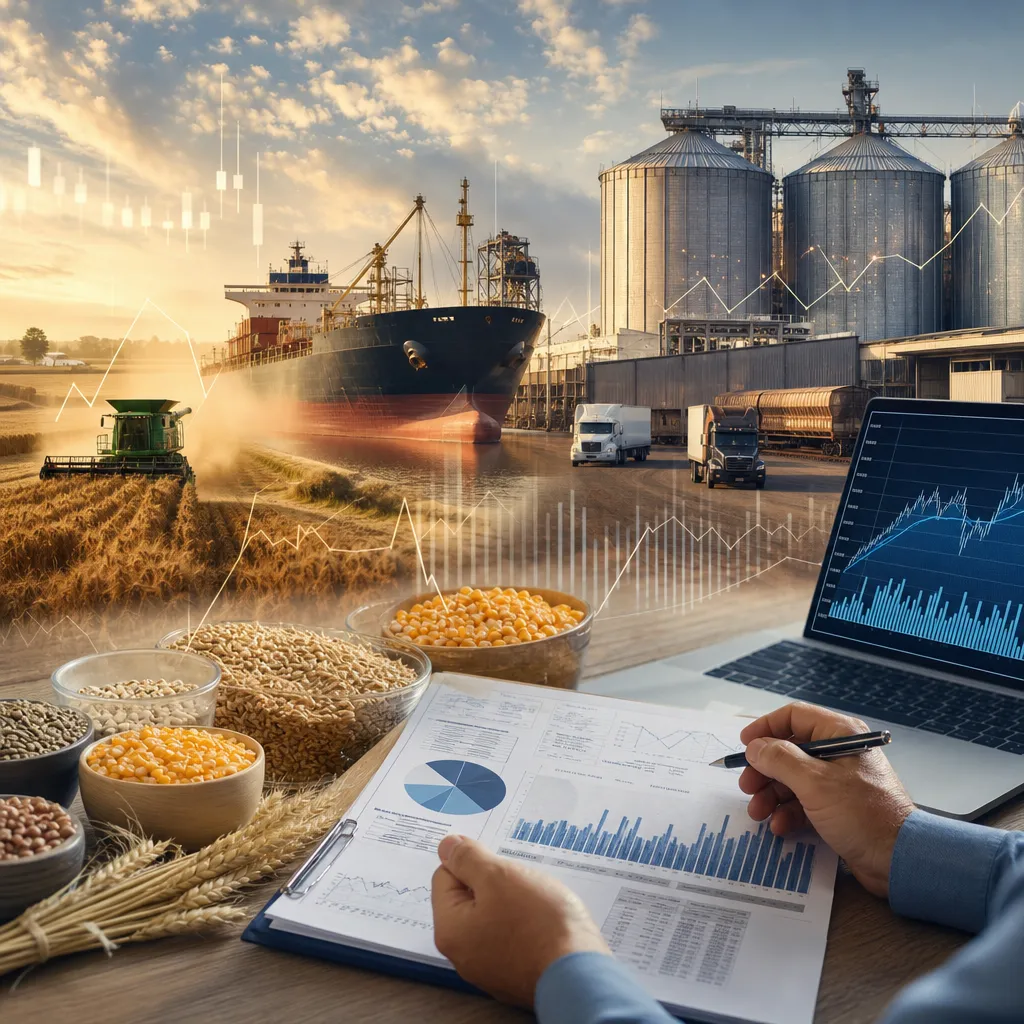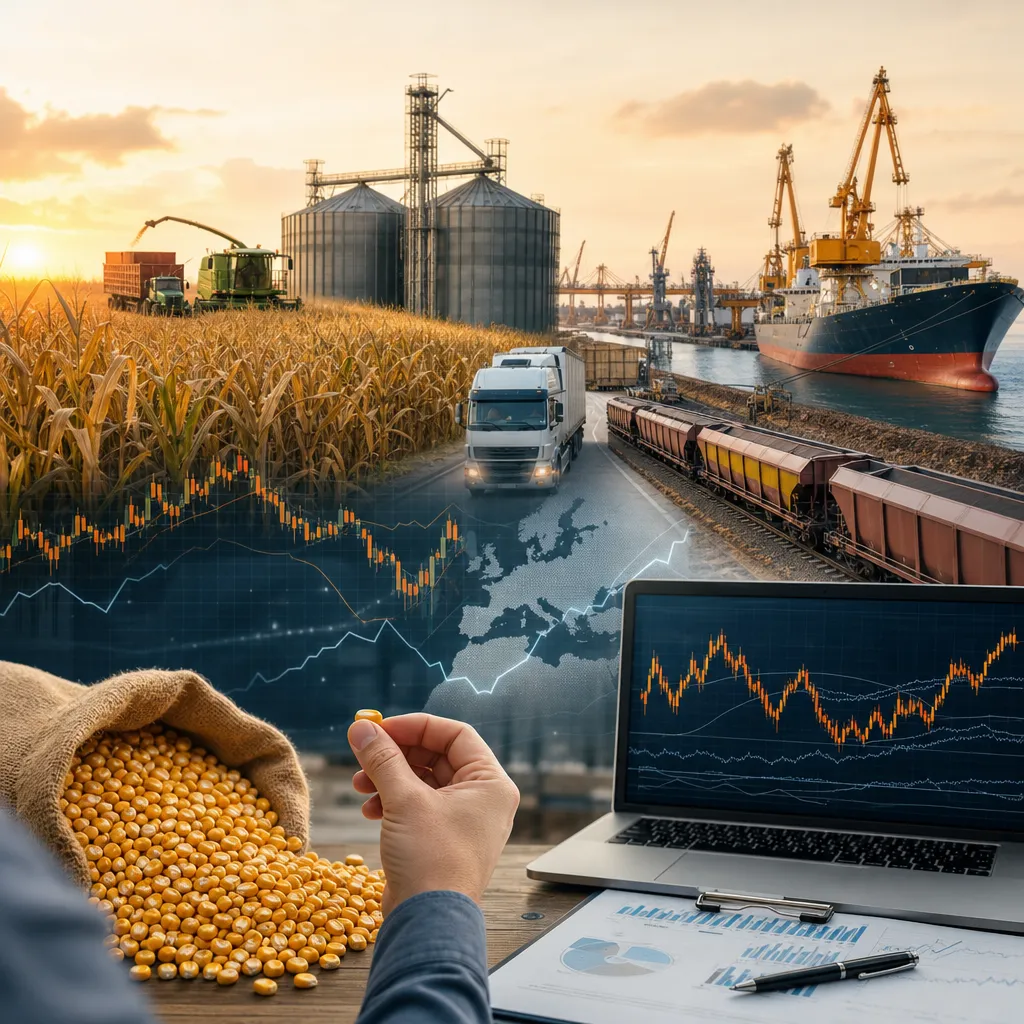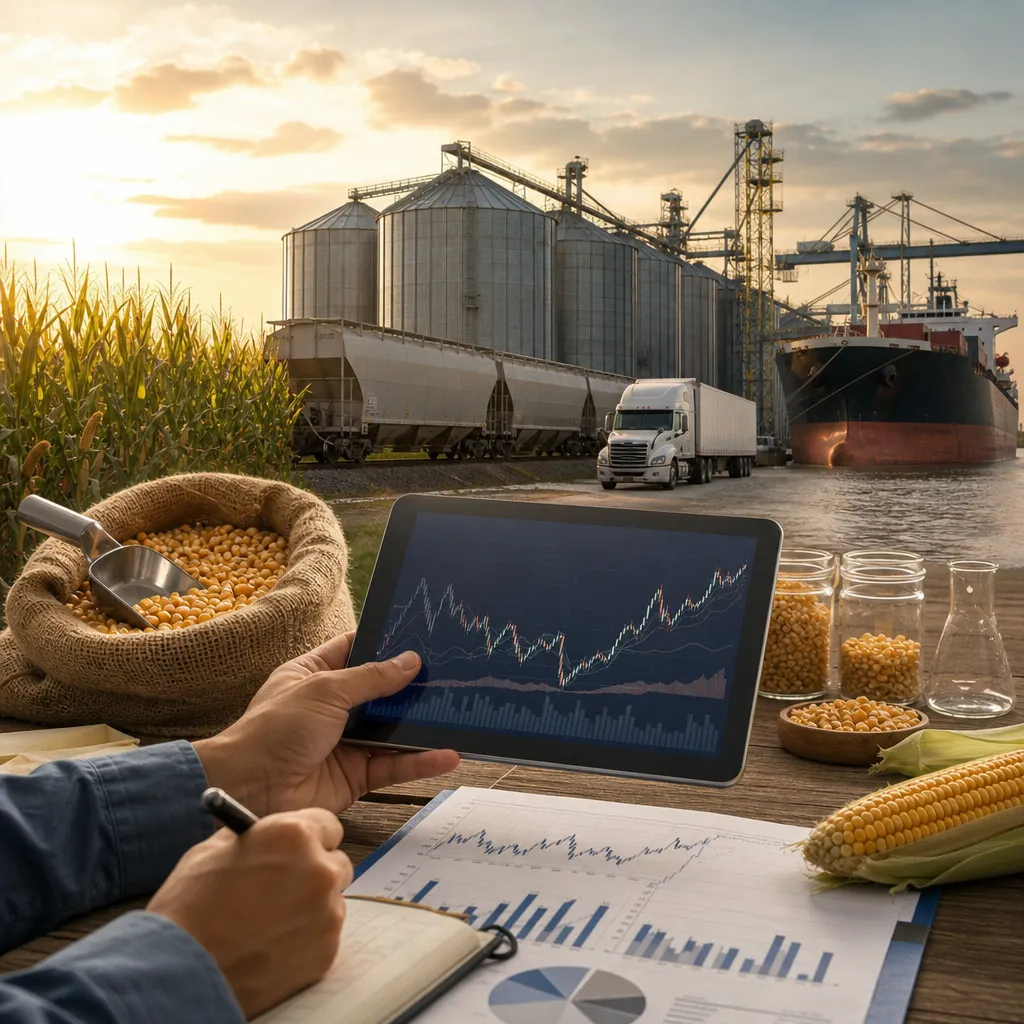
Technical analysis for grain is the study of price, volume, spread, and market structure on grain charts to help decide when to buy, sell, hedge, or stand aside. In practice, it is used most often on exchange-traded futures such as corn, wheat, soybeans, soybean meal, soybean oil, canola, and related options, then combined with local cash-market information like basis, freight, and quality. It does not replace supply-and-demand analysis, weather, or crop reports; it gives traders and commercial users a framework for timing and risk control. The key practical point is that a futures chart is not the same thing as a local elevator bid, export offer, or farmgate price.
For grain markets, technical analysis works best when readers understand exactly which market they are analyzing. A Chicago corn futures chart on CME Group reflects a standardized financial contract traded electronically through a broker, while a local cash bid from an elevator or processor reflects basis, location, quality, storage conditions, and freight. A chart pattern can help with hedging or timing, but the physical sale still happens through elevators, cooperatives, grain merchants, feed mills, processors, or exporters.
What technical analysis means in grain markets
Technical analysis focuses on market behavior visible in price data. In grain, that usually means futures prices, spreads between contract months, options volatility, and sometimes cash-basis charts where data is available. The idea is simple: all known information, including weather concerns, export demand, policy changes, and speculative positioning, tends to show up in price action sooner or later.
Traders and hedgers commonly study:
- Trend: whether prices are generally rising, falling, or moving sideways.
- Support and resistance: price areas where buying or selling has repeatedly appeared.
- Volume: how much trading accompanied a move.
- Open interest: whether positions are building or leaving the market.
- Spreads: differences between nearby and deferred futures months, important for storage and carry.
- Volatility: how fast and how far prices move, crucial for options and risk management.
In grain, this is especially useful because markets react quickly to weather forecasts, USDA reports, export tenders, biofuel demand, and currency moves. Technical analysis helps convert those reactions into a trading or hedging plan.
Where grain technical analysis is actually used
The main venue for grain chart analysis is the regulated futures market. For US benchmark contracts, that usually means CME Group, including CBOT grain futures such as corn, soybeans, and wheat. In Europe and other regions, analysts may also watch other exchange benchmarks where relevant. Futures and options trading normally requires a brokerage account with a regulated futures broker or introducing broker offering exchange access and market-data feeds.
Physical grain is different. Farmers and commercial buyers use technical analysis indirectly to improve timing, but the actual grain transaction normally takes place through:
- local grain elevators,
- agricultural cooperatives,
- grain merchants,
- feed manufacturers,
- flour mills and crushers,
- ethanol plants,
- exporters and port terminals.
Many of these companies quote a cash bid based on futures plus or minus basis. That is where technical analysis becomes practical for physical business: a producer might use chart resistance to make a hedge or forward contract decision, while a mill might use chart support to stage coverage.
| Market type | Where it exists | What technical analysis is used for | Main limitation |
|---|---|---|---|
| Futures | Regulated exchange via broker platform | Timing trades, hedges, exits, spread decisions | Does not equal local cash price |
| Options | Exchange-listed via broker platform | Managing downside or upside with defined structures | Time decay and volatility effects |
| Cash grain | Elevators, co-ops, merchants, processors | Improving sale or purchase timing | Basis, freight, and quality can dominate |
| OTC physical contracts | Direct commercial negotiation | Supporting price ideas and hedge decisions | Counterparty, delivery, and contract-specification risk |
The core tools that matter most for grain
Grain markets do not require dozens of indicators. A practical grain analyst usually starts with a small set of tools and checks whether they align with fundamentals.
Trend and moving averages
Moving averages smooth daily noise. A rising market above medium- and long-term averages suggests strength; a falling market below them suggests weakness. In grain, these are often used to avoid fighting a weather-driven breakout or a harvest-pressure downtrend.
Support and resistance
These are highly relevant in grains because commercial hedging often clusters around well-known price zones. Producers may sell new crop against rallies, while end users may buy breaks for coverage. When prices repeatedly fail at one level or hold another, chart users mark those areas for hedge orders, stop placement, or option strategies.
Volume and open interest
If corn or soybeans break higher on strong volume and rising open interest, it may suggest fresh buying rather than only short covering. Exchange websites and broker platforms may provide some of this data directly, while analytical software often charts it more clearly.
Relative strength and momentum
Momentum indicators can help identify when a move is accelerating or losing force. In grain they are best used as a secondary tool, not as a standalone signal, because a USDA report or weather shift can quickly invalidate an overbought or oversold reading.
Seasonality and spreads
Seasonality matters more in grain than in many other markets. Harvest pressure, planting uncertainty, and export programs create recurring patterns. Futures spreads between nearby and deferred months can also reveal whether the market is paying to store grain or urging it into immediate movement.
How grain traders and hedgers apply chart analysis in practice
A speculative trader may use a futures chart to enter and exit positions. A commercial grain user usually applies technical analysis differently: as a timing tool inside a broader merchandising plan.
- Define the market: old crop or new crop, nearby or deferred futures, and the relevant local cash market.
- Check the chart structure: trend, major support/resistance, and whether the market is consolidating or breaking out.
- Overlay fundamentals: USDA reports, export sales, weather maps, crop condition, and macro factors such as currencies or energy.
- Choose the instrument: cash sale, hedge-to-arrive contract, futures hedge, minimum-price strategy, or options position.
- Set risk controls: stop-loss for speculative trades, hedge size for commercial trades, and maximum premium or margin exposure.
- Monitor basis and logistics: because a good futures call can still produce a poor local sale if basis weakens or freight rises.
For example, a farmer may see December corn futures reach a chart resistance zone during a weather rally. Instead of selling physical grain on the spot, the farmer might forward contract part of expected production with a local elevator, or hedge using futures through a broker if basis is expected to improve later. The chart helps with timing; the local bid and delivery terms determine the actual economics.
Where to get grain charts, prices, and technical market data
Reliable chart analysis starts with reliable data. For grain futures, the primary benchmark source is the exchange itself, especially CME Group for major US grain contracts. Broker platforms commonly provide live or delayed charts, depth of market, historical data, and technical indicators depending on the account and data package.
For physical grain pricing, readers normally check:
- local elevator and cooperative bid sheets,
- processor bids such as crushers, mills, or ethanol plants,
- grain merchant purchase programs,
- official agricultural market reporting services where available,
- regional cash reporting agencies and farm-market publications.
For reports that help confirm or challenge chart signals, the most important public sources often include USDA market reports, CFTC trader-positioning data, and official crop progress or export reports. These are used not for charting alone, but to understand why a breakout or reversal may be happening.
| Source type | What it provides | Who uses it | How it helps technical analysis |
|---|---|---|---|
| Exchange data | Futures prices, volume, open interest, contract specs | Traders, hedgers, analysts | Foundation for charts and contract selection |
| Broker platforms | Charting tools, order entry, indicators | Active futures and options users | Execution and risk management |
| USDA reports | Supply, demand, exports, crop conditions, stocks | Farmers, merchandisers, funds, processors | Tests whether chart moves are supported by fundamentals |
| CFTC positioning data | Commitments of Traders categories | Analysts and traders | Shows speculative crowding and hedger activity |
| Local cash bids | Actual purchase prices at delivery locations | Farmers, buyers, merchandisers | Connects futures analysis to real selling opportunities |
Futures charts versus local grain bids
This is the distinction that matters most in real-world grain marketing. A futures contract is a standardized exchange instrument with a delivery month, contract size, grade specification, and clearing system. A local grain bid is a commercial offer at a specific location and time.
The local cash price is often expressed as:
Cash price = futures price + or – basis
Basis reflects local supply and demand, transport costs, storage capacity, processor demand, export flows, and quality differences. A technically bullish futures chart does not guarantee a better local bid if basis weakens because harvest is heavy or freight is constrained. Likewise, futures may look weak while a nearby processor bid improves because of urgent spot demand.
This is why experienced grain marketers track both the board and the basis. Technical analysis belongs mostly to the board side. Cash marketing decisions require both.
Limits and risks of technical analysis for grain
Technical analysis can be very useful, but grain is not a purely chart-driven market. Several risks are specific to agricultural commodities.
- Report shock: USDA releases can trigger sharp moves that break chart patterns instantly.
- Weather volatility: forecast changes during planting and pollination can reverse trends quickly.
- Basis risk: the futures hedge may work while the local cash market does not.
- Contract roll risk: charts can behave differently as liquidity shifts from one futures month to another.
- Leverage: futures require margin and can generate losses larger than expected if risk is not controlled.
- False signals: low-volume periods or holiday trade can create unreliable breakouts.
For physical grain businesses, another limitation is quality. Protein, moisture, test weight, damage, mycotoxins, oil content, and other specifications can change the cash value significantly, even when futures are stable.
A practical workflow for farmers, merchandisers, and traders
A disciplined process is more useful than any single indicator.
- Choose the benchmark contract that matches the crop and marketing period you care about.
- Pull a daily and weekly chart from an exchange data source, broker platform, or charting service.
- Mark major price zones where rallies failed or declines found support.
- Check volume, open interest, and spreads to see whether the move has commercial confirmation.
- Review public reports such as WASDE, Crop Progress, Export Sales, or stocks reports.
- Call or check bids from local buyers including elevators, processors, mills, or co-ops.
- Pick the tool: cash sale, storage decision, hedge, option, or no action.
- Define the failure point before entering any futures or options trade.
This workflow can be done partly online and partly in the physical market. Charts, exchange data, and reports are online. The actual grain movement, grading, and settlement happen through the grain trade infrastructure: truck scales, warehouses, rail loaders, barges, mills, crushers, ethanol plants, and port terminals.
Frequently asked questions
Where can I check grain prices for technical analysis?
For futures charts, start with the relevant exchange data and a broker or charting platform. For local selling prices, check elevator, cooperative, processor, or merchant bids. Use both, because futures are not the same as cash grain prices.
Can I trade grain directly from a chart?
You can trade grain futures or options through a regulated broker if that service is available in your jurisdiction, but that is financial trading, not physical grain buying. To buy or sell actual grain, you normally transact with elevators, co-ops, merchants, processors, or exporters under commercial terms.
What is the most important chart concept for farmers?
Support and resistance are often the most practical because they help identify sale zones, hedge timing, and option decision points. But they should always be checked against basis and local delivery opportunities.
Does technical analysis work better on corn, wheat, or soybeans?
It can be applied to all of them, but each market has different seasonal patterns, liquidity, and weather sensitivity. Soybeans often react sharply to South American weather and export demand, corn to yield and feed or ethanol demand, and wheat to global supply disruptions and quality differences.
How do grain spreads fit into technical analysis?
Spreads between nearby and deferred futures months help show carry, tightness, and storage incentives. Merchandisers and commercial firms watch them closely because spreads can matter as much as the flat price when managing inventory.
What is the biggest mistake beginners make?
The biggest mistake is treating a futures chart as if it were the farmgate price. The second is ignoring risk management, especially margin exposure, report dates, and basis movement.
Do I need paid software for grain technical analysis?
Not always. Basic delayed charts and official report calendars are often available from exchanges and public agencies. Active traders may prefer broker platforms or professional charting software for live data, order execution, alerts, and deeper analytics.
Sources
- CME Group
- USDA World Agricultural Supply and Demand Estimates
- U.S. Commodity Futures Trading Commission Commitments of Traders