







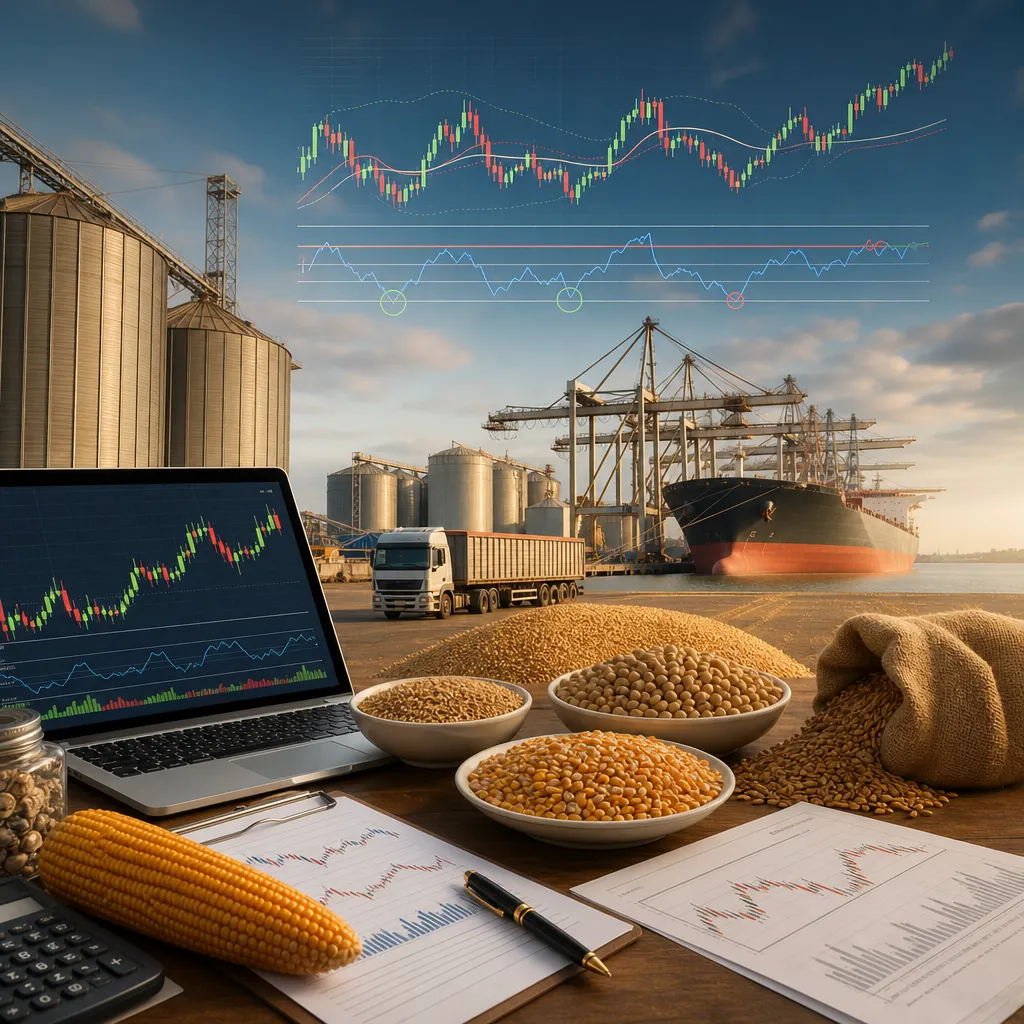
A grain RSI trading strategy uses the Relative Strength Index to time entries and exits in grain markets such as corn, wheat, soybeans, canola, oats, or rice-linked contracts. In practice, it is most often applied to exchange-traded futures and options, not to direct farm-gate grain sales, although physical buyers and sellers may use the same signals to improve hedge timing. The key idea is simple: RSI measures recent price momentum on a scale from 0 to 100, helping traders identify markets that may be overbought, oversold, or shifting trend. The strategy becomes useful only when it is combined with the structure of grain markets: contract months, seasonality, USDA reports, weather risk, basis, and the difference between futures prices and local cash bids.
For most readers, the practical place to use a grain RSI strategy is through a regulated futures broker that offers access to exchanges such as CME Group, where major grain futures are listed. If you are a farmer, elevator, feed mill, crusher, exporter, or merchandiser, RSI may also be used as a timing tool around a hedge program rather than as a stand-alone speculation system. It is not a replacement for cash market knowledge, quality terms, freight, or storage decisions.
What a Grain RSI Trading Strategy Is
RSI, or Relative Strength Index, is a momentum indicator created by J. Welles Wilder. It compares recent upward closes with recent downward closes and converts that relationship into a number between 0 and 100. Many traders use a 14-period RSI by default, although shorter settings react faster and longer settings react more slowly.
In grain trading, RSI is commonly used in three ways:
- Mean reversion: buying when RSI signals an oversold condition and selling when it signals an overbought condition.
- Trend confirmation: using RSI above or below a midpoint such as 50 to confirm bullish or bearish momentum.
- Divergence analysis: watching for a mismatch between price and RSI, which may suggest weakening momentum.
The strategy can be applied to grain futures charts, grain-related ETFs where available, or OTC market analysis used by merchants and commercial firms. However, the underlying execution usually happens in the futures market, while the physical grain trade remains a separate transaction involving basis, grade, location, and logistics.
Where Grain RSI Trading Is Actually Used
Most grain RSI trading is used on exchange-traded futures. The main venue for benchmark grain futures is CME Group, especially CBOT grain contracts such as corn, soybeans, soybean meal, soybean oil, and wheat. Other agricultural exchanges may list relevant contracts depending on the crop and region. Access is normally through a regulated futures broker or futures commission merchant, using a desktop, web, or mobile trading platform.
That is the financial side. The physical side is different. Farmers normally sell grain to:
- local grain elevators,
- agricultural cooperatives,
- feed mills,
- ethanol plants,
- oilseed crushers,
- merchants or exporters,
- processors or millers.
Those cash transactions are based on local bids, which usually reflect a futures reference price plus or minus a local basis. A farmer may look at an RSI signal on December corn futures, for example, but the actual local cash bid received at an elevator can still differ because of freight, storage congestion, quality, and regional supply-demand conditions.
| Market Type | What It Provides | Who Uses It | How RSI Fits |
|---|---|---|---|
| Futures exchange | Standardized contracts, transparent price discovery, clearing | Speculators, hedgers, merchants, funds, processors | Primary place to calculate signals and execute trades |
| Broker trading platform | Charting, order entry, margin account access | Retail and professional futures traders | Used to apply RSI, alerts, and risk controls |
| Local cash grain market | Physical grain bids with basis, grade, and delivery terms | Farmers, elevators, mills, feed companies | Used indirectly for hedge timing, not direct indicator execution |
| OTC forward contract market | Negotiated price and delivery agreements | Commercial grain firms and producers | Can help decide when to lock price, but contract terms matter more |
How the RSI Indicator Works in Grain Markets
RSI does not measure supply, demand, acreage, or weather. It measures price behavior. That matters because grain markets frequently react sharply to report releases, planting delays, drought, export surprises, and fund positioning. RSI helps structure that reaction into a repeatable process.
A common interpretation is:
- Above 70: potentially overbought
- Below 30: potentially oversold
- Above 50: momentum often considered bullish
- Below 50: momentum often considered bearish
But in grains, these levels should not be treated mechanically. During a weather rally, wheat or corn can stay overbought for much longer than traders expect. During harvest pressure, a market can stay oversold while cash movement remains heavy. That is why experienced grain traders usually combine RSI with:
- support and resistance,
- trend direction,
- volume and open interest,
- seasonal context,
- major USDA release dates,
- CFTC positioning data.
For example, a bullish RSI crossover shortly before a major WASDE report may be less reliable than the same signal in a quiet period. Likewise, an oversold signal in soybeans during a South American weather scare may fail if forecast conditions tighten supply expectations further.
How to Build a Practical Grain RSI Strategy
A usable strategy needs rules. Without rules, RSI becomes subjective and easy to misuse. Many traders build the strategy around one contract, one timeframe, one RSI setting, and one risk-management method, then test it over multiple market phases.
Basic structure
- Choose the grain market. For example, CBOT corn, soybeans, or wheat.
- Choose the contract month. Trade the most liquid delivery month rather than an illiquid deferred contract.
- Choose the timeframe. Daily charts are common for swing trading; intraday charts are used by shorter-term traders but are more sensitive to noise.
- Set the RSI period. Fourteen periods is the standard starting point.
- Define entry rules. Example: buy only when RSI moves back above 30 after an oversold reading, and only if price is above a major support zone.
- Define exit rules. Example: take profits near resistance or exit if RSI reaches an upper threshold and momentum stalls.
- Define risk limits. Maximum loss per trade, position size, and margin tolerance should be pre-set.
Example logic
A trader may decide to buy corn futures when:
- the daily RSI falls below 30,
- then closes back above 30,
- price holds a chart support area,
- and there is no major report due within the next session unless that event risk is intentionally part of the strategy.
A hedger may use a different version. For example, a grain producer planning cash sales may watch for an overbought RSI in futures to decide whether to place a hedge using short futures or buy put options. In that case, the objective is not to profit from the chart alone. It is to protect a physical grain position while still monitoring local basis separately.
| RSI Use Case | Typical Rule | Main Limitation |
|---|---|---|
| Mean reversion long | Buy after RSI recovers from oversold territory | Can fail in strong downtrends or harvest pressure |
| Mean reversion short | Sell after RSI rolls over from overbought territory | Can fail during weather or export-driven rallies |
| Trend confirmation | Trade only when RSI remains on the bullish or bearish side of 50 | Late entries are common |
| Hedge timing | Use RSI extremes to help decide when to price or hedge futures exposure | Cash basis and quality can move independently |
Where to Get Grain Prices, Charts, and RSI Data
For futures prices and contract specifications, the most relevant public source is usually the exchange itself, especially CME Group for CBOT grain futures. It provides contract months, units, delivery terms, and market references. For charting and RSI calculation, traders typically use broker platforms or third-party charting software connected to market data.
For physical grain prices, the process is different. Farmers and cash-market participants usually check:
- local elevator bid sheets,
- cooperative pricing pages or text alerts,
- merchant procurement desks,
- processor bids,
- government or regional market reporting services where available.
These are cash bids, not futures quotes. They can vary significantly by location and delivery period. A strong RSI setup in futures does not guarantee a favorable cash sale if basis weakens, wet grain discounts increase, or freight becomes expensive.
For market-moving reports, traders commonly monitor:
- USDA WASDE for supply-demand balance changes,
- USDA Crop Progress for planting, condition, and harvest pace,
- USDA Export Sales for export demand signals,
- CFTC Commitments of Traders for fund and commercial positioning.
These reports are used to confirm or challenge an RSI signal. If RSI shows oversold conditions but CFTC data indicates funds are still aggressively selling and weather remains favorable, a reversal may take longer than expected.
Futures Trading Versus Physical Grain Selling
This distinction is critical. A grain RSI strategy usually generates signals in the futures market, but a large share of grain business happens in the cash market.
In futures trading:
- you trade standardized contracts,
- you need a futures brokerage account,
- you post margin,
- your profit or loss changes daily,
- you may close the trade before delivery.
In physical grain selling:
- you negotiate or accept a local bid,
- the transaction involves real grain,
- quality, moisture, protein, test weight, and contamination matter,
- delivery point and freight matter,
- storage and payment terms matter.
A producer might use RSI to decide when to sell futures against expected production, but the final farm revenue still depends on basis and actual delivered quality. A flour mill or feed buyer may also follow RSI for procurement timing while still negotiating freight and origination terms with suppliers.
Risks, Costs, and Limitations
RSI is useful, but it is not a forecasting machine. Grain markets are highly event-driven. One report, one weather shift, or one export restriction can invalidate a technical setup quickly.
Main risks include:
- False signals: RSI often gives repeated reversal signals in strong trends.
- Report risk: USDA reports and major weather changes can cause gap moves.
- Leverage risk: futures are margined products, so losses can exceed what a trader expects if position size is too large.
- Liquidity differences: some contract months are much less active than front months.
- Basis risk: a good futures hedge or signal may not match cash-market movement perfectly.
- Seasonal bias: harvesting, planting, and export windows can alter price behavior.
Costs also matter, even if they differ by broker or merchant. Futures traders should check commissions, exchange and clearing fees, bid-ask spreads, platform costs if any, and data subscription costs if required. Physical sellers should check drying charges, storage costs, shrink, freight, grading discounts, and payment terms.
Best Practices for Farmers, Traders, and Commercial Grain Users
The most effective use of RSI in grains is usually as a decision filter, not a stand-alone system. Traders often combine it with market structure and fundamentals. Commercial users integrate it into a hedge framework.
- Use liquid contracts. Corn, soybeans, and major wheat contracts are usually easier to analyze and execute than thin markets.
- Track the calendar. Know when WASDE, Crop Progress, acreage, grain stocks, and export reports are due.
- Separate futures from basis. A chart signal does not replace local merchandising intelligence.
- Test before using real capital. Back-testing and forward-testing can reveal whether a rule set fits a grain market.
- Match timeframe to purpose. A day trader, a hedger, and a post-harvest cash seller should not use the same RSI rules.
- Define delivery exposure. If holding a futures position near expiration, know contract delivery procedures and first notice timing.
For farms and grain businesses, the practical workflow is often: monitor futures charts and RSI online, watch local basis from elevators or processors, review official crop and positioning reports, then decide whether to hedge, price grain, store longer, or stay unpriced.
FAQ
Where can I use an RSI strategy to trade grain?
Usually through a regulated futures broker with access to grain contracts listed on exchanges such as CME Group. The RSI signal is normally applied on a charting platform connected to that brokerage or to a separate data service.
Can I use RSI to sell my physical corn, wheat, or soybeans?
Yes, but indirectly. RSI may help with timing, while the actual sale usually happens through an elevator, cooperative, merchant, processor, or feed buyer at a local cash bid. The signal does not determine your final basis or quality adjustments.
Where do I check grain prices for this strategy?
Check futures prices on exchange-related market data or broker platforms, and check local cash prices from elevator bid sheets, cooperative offers, processor bids, or regional market reporting services. These are different price streams and should not be treated as identical.
Is RSI better for futures trading or hedging?
It can be used for both, but in different ways. Speculators may use RSI for entry and exit signals, while hedgers may use it to improve the timing of futures hedges or options purchases around physical grain exposure.
What reports matter most when trading a grain RSI strategy?
USDA WASDE, USDA Crop Progress, USDA Export Sales, and CFTC Commitments of Traders are among the most important. They provide context on supply-demand changes, crop conditions, export demand, and market positioning.
Does an overbought RSI mean grain prices must fall?
No. In a strong weather rally or major supply scare, grain prices can remain overbought for an extended period. RSI should be read with trend direction, report timing, and broader market context.
What is the main mistake beginners make with RSI in grain markets?
Treating every oversold or overbought reading as an automatic reversal signal. Grain markets can trend strongly, especially during seasonal or weather-driven periods, so RSI needs confirmation and disciplined risk management.
Sources
- CME Group
- USDA World Agricultural Supply and Demand Estimates
- U.S. Commodity Futures Trading Commission, Commitments of Traders