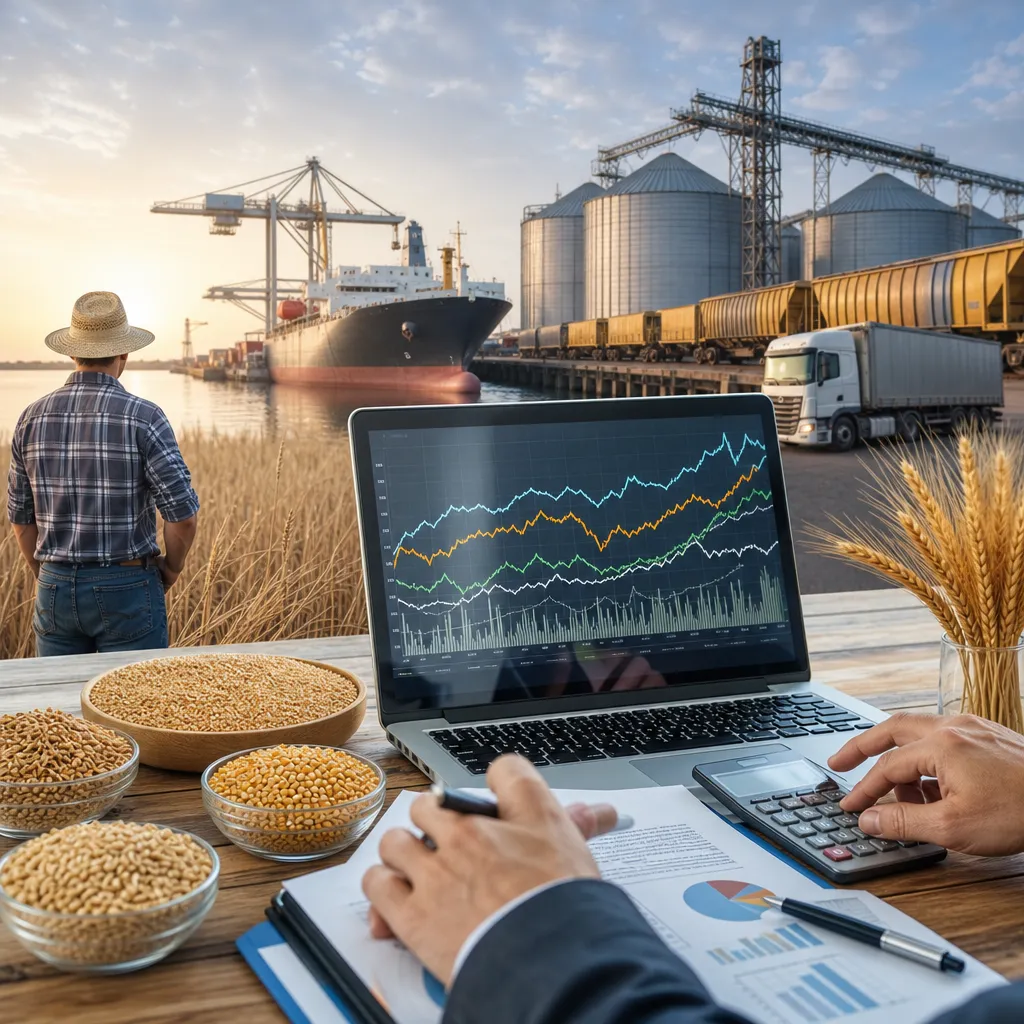




Grain prices by decade are best understood as a long-cycle story of inflation, technology, policy, weather, trade, and energy markets rather than as a simple chart of numbers. Wheat, corn, soybeans, rice, barley, oats, and oilseeds do not move together in every period, but they are linked by acreage competition, feed demand, export flows, and storage economics. When people look up decade-by-decade grain prices, they are usually trying to compare historical eras, judge whether today’s market is high or low in real terms, or understand how futures benchmarks relate to local cash bids. The practical way to do that is to separate exchange-traded futures history from physical cash market history, then check the official data sources that publish both.
What “grain prices by decade” actually means
The phrase can refer to several different things, and using the wrong one causes confusion.
- Futures benchmark prices: exchange-traded contracts such as Chicago wheat, corn, and soybeans. These are standardized financial and delivery contracts quoted daily on regulated exchanges.
- Farm or local cash prices: the price paid by a local elevator, cooperative, processor, mill, or feed buyer in a specific location. This includes local supply, freight, quality, and basis.
- National average farm prices: official historical series published by government agencies, often useful for long-term comparisons.
- Export or port values: prices at major shipping locations, often used in international trade.
- Inflation-adjusted prices: historical prices converted into real purchasing power, which is often more meaningful for decade comparisons.
If you want to compare grain prices across the 1970s, 1980s, 1990s, 2000s, and 2010s, the first practical question is: which market and which unit? Corn futures in cents per bushel, wheat export values in dollars per metric ton, and average farmgate prices are not interchangeable.
How grain prices changed across the decades
At a broad level, grain prices tend to move through long periods of relative weakness interrupted by short, violent spikes. Those shifts are usually driven by combinations of weather stress, policy changes, export booms, macroeconomic inflation, currency swings, and stock levels.
| Decade | Typical market character | Common drivers |
|---|---|---|
| 1970s | High volatility and strong price inflation | General inflation, export demand, policy shifts, supply shocks |
| 1980s | Pressure from large supplies and policy adjustment | Weak farm economics, changing support programs, burdensome stocks |
| 1990s | Generally moderate prices with episodic rallies | Improved productivity, export demand, occasional weather events |
| 2000s | Structural repricing upward and more volatility | Biofuels, China demand, lower stock buffers, energy linkage |
| 2010s | Early spike, then long phase of supply-heavy pressure | Large harvests, global competition, Black Sea exports, trade disputes |
| 2020s so far | Sharp shocks followed by fast repricing | Pandemic disruption, war risk, inflation, weather extremes, logistics |
These are not exact price averages. They are the practical character of each decade. For exact historical numbers, readers normally use USDA historical farm price series, exchange settlement archives, or long-run commodity databases from recognized market-data vendors.
Why one decade looks expensive and another looks cheap
Nominal prices alone can mislead. A grain price from the early 1980s may look low next to a current futures quote, but in real terms the comparison may be very different after inflation.
Five forces explain most decade-to-decade changes:
- Inflation and interest rates: broad economic inflation raises nominal prices, while high interest rates affect storage, farm finance, and speculative positioning.
- Yield growth: better genetics, crop protection, mechanization, and agronomy tend to expand supply over time.
- Stocks-to-use: when inventories are tight relative to consumption, prices usually become more sensitive to weather and logistics disruptions.
- Trade structure: the rise of major exporters and importers can reshape price formation. Black Sea wheat, Brazilian soybeans, and Asian feed demand changed global benchmarks over time.
- Energy linkage: fertilizer, drying, freight, diesel, and biofuel demand connect grain to oil and natural gas markets.
This is why a decade analysis should include both nominal and real prices, and should distinguish between crops. Soybeans in a China-driven import era do not necessarily behave like oats or rye.
Where to find decade-by-decade grain price data
Reliable historical grain prices exist in both public and commercial sources. The right source depends on whether you need farm economics, futures history, export values, or local cash records.
| Source type | What it provides | Who uses it | How it is used |
|---|---|---|---|
| USDA historical price and market series | Farm prices, marketing-year averages, supply-demand context | Farm managers, economists, analysts | Long-run comparisons, farm income studies, inflation-adjusted analysis |
| CME Group contract data | Futures and options history for major grains and oilseeds | Traders, hedgers, brokers, researchers | Benchmark tracking, seasonal analysis, hedging back-tests |
| Government market reports | Production, exports, stocks, crop conditions | All market participants | Explaining why prices changed in a given decade or year |
| Local elevator or cooperative archives | Cash bids in specific regions | Farmers, merchandisers, lenders | Local basis history, delivery pricing, storage decisions |
| Commercial market-data vendors | Clean historical databases, charting, export values, basis and spreads | Professional traders, processors, analysts | Cross-market analysis, report preparation, model building |
For U.S.-centered grain history, USDA is usually the first stop. For futures charts, CME Group provides official contract information and market structure. For local historical cash values, the most practical real-world source is often the elevator, cooperative, grain merchant, or processor that actually posted bids in that area.
Futures prices versus local cash prices by decade
This distinction matters more than almost anything else.
Futures prices are exchange-traded benchmark contracts. In grains, many of the best-known contracts trade at CME Group exchanges. These contracts have standardized quality, quantity, delivery terms, and contract months. Their historical series are useful for benchmarking decades because the record is transparent and continuous.
Cash prices are what physical grain buyers actually offer at a place and time. A local elevator bid for corn or wheat reflects:
- the relevant futures month,
- local basis,
- freight,
- storage space,
- quality and moisture,
- regional supply,
- end-user demand.
A futures rally in one decade does not mean every farmer received the same improvement in local prices. In a region with weak basis, freight bottlenecks, or quality discounts, the local cash market may underperform the benchmark. In export years with strong nearby demand, basis may improve sharply and local cash can rise faster than futures.
Readers who want a decade comparison for farm decision-making should ideally compare:
- historical futures levels,
- historical local basis,
- storage and interest costs,
- inflation-adjusted returns.
How grain market participants use decade history in practice
Different users read decade price history differently.
Farmers and farm managers
They use long-run price history to stress-test budgets, evaluate crop rotation economics, and compare current forward bids with prior-cycle opportunities. The practical tools are local elevator bid sheets, cooperative marketing programs, farm accounting records, and USDA historical price data.
Grain elevators and merchandisers
They study decades of basis behavior, carry structure, harvest pressure, and freight patterns. Their work happens in both the physical market and the futures market. They buy grain physically, hedge risk with futures or options through brokerage access, and monitor spreads, storage margins, and delivery points.
Processors, mills, feed companies, and exporters
These users compare long-term input price cycles with product margins. A flour mill watches wheat class spreads and protein premiums. A feed manufacturer watches corn, sorghum, barley, and soybean meal substitution. An exporter compares inland origination costs with port values and vessel economics.
Speculators and investors
They use decade history to identify volatility regimes, seasonality, and macro linkages. But they trade financial exposure through regulated futures and options accounts, not by taking truckloads of grain. A brokerage account, margin funding, and risk controls are required. Exchange trading is not the same as buying physical grain from a merchant.
How to check historical grain prices correctly
A practical process helps avoid apples-to-oranges mistakes.
- Define the crop and grade. Wheat alone may mean soft red winter, hard red winter, spring wheat, or another class. Quality differences change price history.
- Choose the market type. Decide whether you need futures, farmgate, export, or local elevator bids.
- Choose the unit. Bushels, metric tons, and hundredweights are different. International comparisons often require unit conversion.
- Check the time basis. Calendar-year average, crop-year average, month-end settlement, or harvest-time cash average can tell different stories.
- Adjust for inflation if comparing decades. This is especially important for the 1970s and early 1980s.
- Add context from reports. Use supply-demand reports, crop reports, and export data to understand why a decade behaved the way it did.
Without those steps, historical comparisons often mix local bids from one region with benchmark futures from another, or compare nominal values from different inflation eras as if they were directly comparable.
Where grain prices are discovered in the online and physical market
Price discovery happens in several places at once.
Online futures markets: benchmark prices are discovered on regulated exchanges. Market participants typically access them through futures brokers, brokerage platforms, and professional market-data terminals. These are used for hedging and speculation, not necessarily for sourcing physical grain.
Physical cash market: grain is bought and sold through elevators, cooperatives, grain merchants, feed mills, flour mills, crushers, ethanol plants, exporters, and importers. Transactions may be spot, forward cash, basis contracts, hedge-to-arrive contracts, or privately negotiated supply agreements, depending on local practice and regulation.
Government and public reporting: official market reports do not set prices directly, but they influence expectations. USDA reports are especially important for U.S. and global grain benchmarks. Export sales, crop progress, stocks reports, and WASDE updates often reshape market sentiment.
Commercial data services: many professional users rely on historical databases, charting software, and APIs for futures, basis, freight, and trade analytics. These are useful when building decade analysis across multiple crops and regions.
In the real world, a farmer may see one price on a charting app and a different bid from a nearby elevator. That is normal. The difference is the basis and local commercial conditions.
Main limitations when comparing grain prices by decade
- Contract changes: futures contract specifications and market relevance can evolve over time.
- Regional bias: local cash histories from one state, province, or port do not represent the whole market.
- Inflation distortion: nominal values can exaggerate or understate economic reality.
- Quality drift: changes in grading standards, protein levels, moisture expectations, or delivery rules can affect comparability.
- Policy interference: subsidies, embargoes, tariff regimes, biofuel mandates, and currency management can all alter price behavior.
- Survivorship of data: long historical series may be easier to find for major crops than for regional grains such as rye, oats, or sorghum in certain markets.
For serious work, decade comparisons should be treated as analytical tools, not as direct forecasts. Historical ranges help frame risk, but they do not guarantee future outcomes.
Where can I check historical grain prices by decade?
Start with USDA historical data for farm and market prices, then use CME Group for futures contract history. For local cash history, ask the elevator, cooperative, processor, or grain merchant that posts bids in your area. Professional analysts may also use commercial data vendors for cleaner long-run series.
Are futures prices the same as the price a farmer receives?
No. Futures are benchmark exchange prices. A farmer usually receives a local cash bid from an elevator, cooperative, processor, or end user. That cash bid equals the local pricing formula, usually involving futures plus or minus basis, with possible deductions for moisture, quality, or freight.
How do I compare wheat or corn prices from different decades fairly?
Use the same market series, the same unit, and ideally inflation-adjust the data. It also helps to compare seasonal timing, such as harvest averages versus annual averages. Mixing export values, futures settlements, and local cash bids usually produces misleading results.
Where does physical grain trading happen?
Physical trading normally happens through grain elevators, cooperatives, merchants, processors, feed companies, mills, exporters, and importers. Transactions may be negotiated by phone, email, internal bid platform, broker, or direct contract. Delivery point, quality terms, freight responsibility, storage, and payment terms all matter.
Where does grain futures trading happen?
Grain futures and options trading usually happens on regulated commodity exchanges and is accessed through licensed futures brokers or approved brokerage platforms. This is financial trading with margin and leverage. It is different from buying or selling truckloads, railcars, or vessel cargoes of physical grain.
What reports help explain grain prices over time?
USDA reports are central for many markets, especially WASDE, Grain Stocks, Crop Production, Crop Progress, and Export Sales. Traders and analysts also monitor exchange data and positioning reports such as Commitments of Traders from the CFTC for insight into market participation and sentiment.
Why do local grain prices differ between regions in the same decade?
Because basis differs by location. Basis reflects transportation costs, storage pressure, local competition among buyers, export access, processor demand, quality, and temporary logistics constraints such as rail disruption or port congestion.
Can decade price history be used for hedging decisions?
Yes, but carefully. Historical price ranges, basis patterns, and carry structure can help with hedge timing and contract selection. However, hedging decisions should also account for current stocks, weather, cash flow needs, margin risk, delivery windows, and local basis behavior.
Sources
- USDA Economic Research Service
- CME Group
- USDA World Agricultural Supply and Demand Estimates