







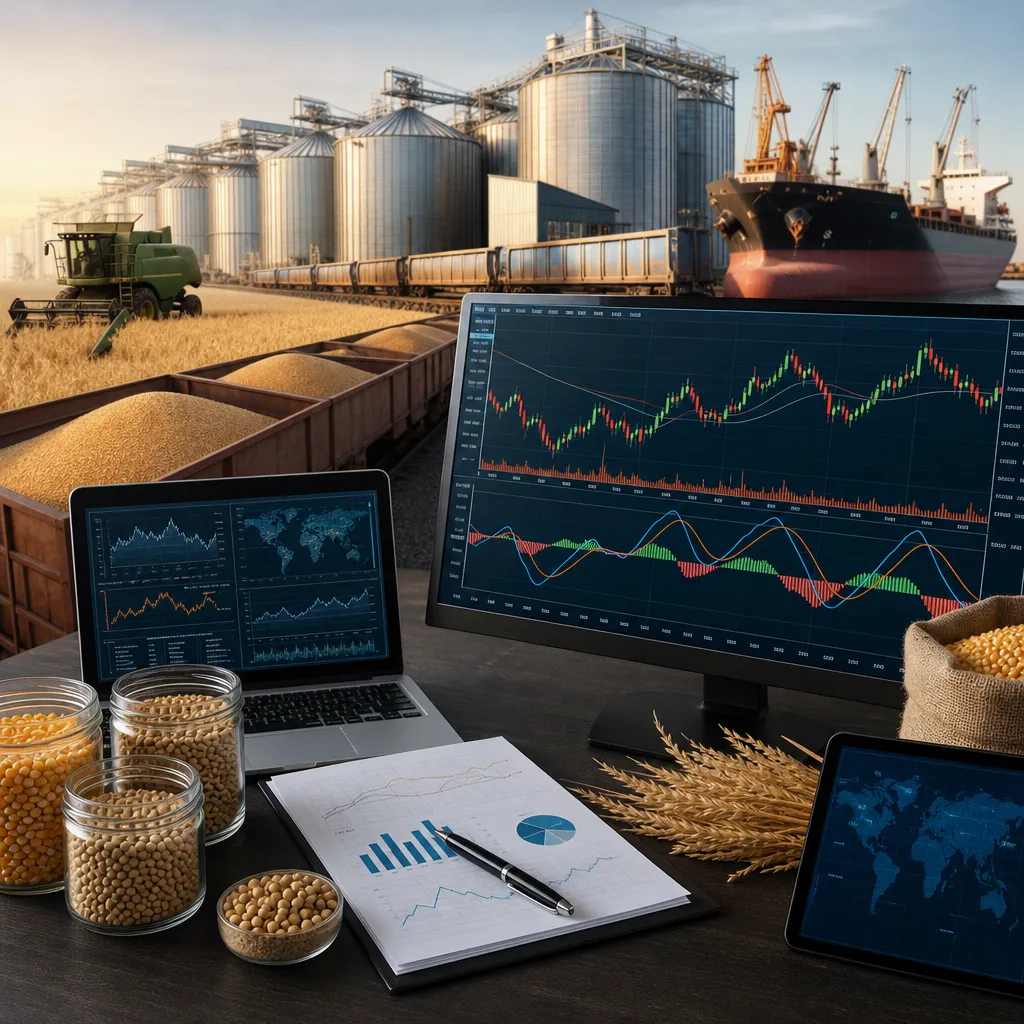
A grain MACD trading strategy uses the Moving Average Convergence Divergence indicator to identify momentum shifts in grain futures such as corn, wheat, soybeans, canola, and related contracts. In practice, it is most useful for timing entries and exits within a broader grain market framework that also includes crop reports, weather, basis, spreads, and seasonal patterns. The strategy is usually applied on regulated futures exchanges through a commodities broker, not by directly buying physical grain. That distinction matters because a MACD signal on a futures chart does not automatically tell a farmer what a local elevator will bid for cash grain.
For grain markets, MACD can help traders, hedgers, and analysts judge whether price momentum is strengthening or weakening. It is not a forecasting tool by itself, and it works best when combined with support and resistance, volume, volatility, USDA reports, and awareness of contract expiry and rollover.
What a grain MACD trading strategy is
MACD is a chart-based momentum indicator built from moving averages. The standard version compares a shorter-period exponential moving average with a longer-period exponential moving average, then adds a signal line and histogram. Traders watch for crossovers, divergence, and changes in the histogram to assess whether momentum is turning bullish or bearish.
In grain trading, the indicator is commonly applied to futures contracts listed on regulated exchanges. The main benchmarks are often found on CME Group markets, including Chicago Board of Trade contracts for corn, soybeans, soybean oil, soybean meal, wheat, oats, and rough rice, as well as canola-related markets in other jurisdictions where available. A trader usually accesses these contracts through a futures broker and trading platform that provides real-time or delayed charting.
Physical grain participants may still use MACD, but usually as a timing aid rather than a complete marketing plan. A farmer deciding whether to sell corn from storage, for example, should compare the futures signal with local basis, carry, freight, storage cost, moisture and quality condition, and nearby cash demand from elevators, feed mills, processors, or exporters.
How MACD works in grain futures
The indicator has three main components:
- MACD line: the difference between a shorter and longer exponential moving average.
- Signal line: a moving average of the MACD line itself.
- Histogram: the distance between the MACD line and signal line.
The standard settings are often 12, 26, and 9, but grain traders sometimes adjust them depending on timeframe and volatility. Shorter settings react faster but produce more false signals. Longer settings smooth noise but may enter late, which can matter in grains when weather or USDA reports trigger sudden price moves.
| MACD element | What it shows | How grain traders use it |
|---|---|---|
| Bullish crossover | MACD line rises above signal line | Possible long entry or short-covering signal if confirmed by price structure |
| Bearish crossover | MACD line falls below signal line | Possible exit from longs, short entry, or warning for unsold grain inventory |
| Positive histogram expansion | Bullish momentum increasing | Confirms strength after breakout in corn, wheat, or soybeans |
| Negative histogram expansion | Bearish momentum increasing | Confirms downside acceleration, often important around report shocks |
| Divergence | Price and momentum move differently | Can warn that a grain rally or selloff is losing force |
Grain traders often apply MACD on daily charts for swing trading and on weekly charts for broader trend confirmation. Intraday use is possible, but grain futures can be thin or noisy at certain times, especially outside major report windows and regular commercial participation.
Where the strategy is used
The grain MACD trading strategy is mainly used in the futures market. That means trading standardized contracts on an exchange through a regulated broker. It does not mean a trader is automatically buying truckloads of physical grain. Futures are financial and hedging instruments first, even though some contracts have delivery mechanisms.
Common places and tools involved include:
- Regulated exchanges: CME Group is central for many grain futures benchmarks.
- Futures brokers: required to open and maintain a trading account, post margin, and place orders.
- Charting and analytics platforms: used to view MACD, trendlines, volume, and contract spreads.
- Commercial grain businesses: elevators, cooperatives, processors, feed manufacturers, exporters, and merchants may monitor futures signals to guide hedge timing.
- Farm marketing tools: some producers compare technical chart signals with local bids from elevators or cooperatives.
For local cash grain, the transaction normally happens through a grain elevator, cooperative, merchant, processor, mill, or feed buyer. The price a seller receives is usually based on futures plus or minus basis, adjusted for quality, delivery location, and timing. Therefore, a MACD buy signal in CBOT corn futures may coincide with a weak local basis, making the cash sale decision less attractive than the futures chart alone suggests.
How to build a practical grain MACD trading setup
A workable strategy needs more than “buy when MACD crosses up.” Grain markets respond to weather, government reports, biofuel demand, export competition, and freight constraints. Practical traders define the market, timeframe, risk limit, and execution plan in advance.
- Choose the grain contract. For example, CBOT corn, soybeans, soybean meal, Kansas City wheat, Chicago wheat, oats, or rough rice.
- Select the timeframe. Daily charts suit many swing traders; weekly charts help identify the larger trend.
- Apply MACD. Use standard settings first unless testing shows a valid reason to change them.
- Add a trend filter. Many traders only take bullish MACD signals when price is above a key moving average or recent resistance.
- Mark report dates. USDA WASDE, Crop Progress, Grain Stocks, Prospective Plantings, and Export Sales can invalidate technical setups quickly.
- Define entry, stop, and exit rules. This is essential because grain futures are leveraged and can move sharply after weather updates or policy news.
- Check contract month and liquidity. Avoid trading a contract near expiry without understanding delivery risk and rollover mechanics.
A common practical approach is to use weekly MACD to identify the broader direction, then use daily MACD pullback signals for entries. This reduces noise compared with relying on a single daily crossover in a sideways market.
Using MACD for speculation versus hedging
The same indicator can serve different purposes depending on the participant.
| Participant | How MACD may be used | Key limitation |
|---|---|---|
| Speculator | Entry and exit timing in futures | False signals in range-bound markets |
| Farmer | Timing hedge sales or cash marketing reviews | Local basis and storage costs may matter more than chart momentum |
| Elevator or cooperative | Monitoring hedge pressure and inventory pricing | Must manage basis exposure, logistics, and customer flow |
| Processor or feed buyer | Timing ingredient coverage or futures hedges | Cash procurement depends on nearby supply and quality |
| Analyst | Momentum confirmation alongside fundamentals | Indicator alone does not explain supply-demand changes |
For hedgers, MACD is usually a timing overlay, not the core reason for the hedge. A soybean processor may need coverage because crush margins and physical buying commitments require it, even if the MACD picture is mixed. A farmer may need to move grain because bin space is tight, even if the indicator suggests momentum could still improve.
Where to find grain prices, charts, and supporting data
Readers using a MACD strategy need both price charts and grain-specific fundamental information. The most important distinction is between exchange futures prices and local cash bids.
Exchange futures prices are benchmark prices for standardized contracts. They are normally checked through exchange websites, broker platforms, market-data terminals, or charting software. CME Group publishes contract specifications and market information for listed grain futures and options.
Local cash bids are the actual prices offered in a region by elevators, cooperatives, processors, feed mills, or exporters. Farmers and physical grain sellers usually check these through elevator bid sheets, cooperative apps or websites, merchant communications, or regional cash market reporting services where available.
Supporting reports that matter when trading grain MACD signals include:
- USDA WASDE: global and U.S. supply-demand balance sheets.
- USDA Crop Progress: planting, condition, and harvest updates.
- USDA Export Sales: export demand indicators.
- USDA Grain Stocks: inventory snapshots that can reset market expectations.
- CFTC Commitments of Traders: positioning data that helps interpret momentum and crowding.
These reports are used to judge whether a technical signal is supported or vulnerable. For example, a bullish MACD crossover in corn just ahead of a bearish acreage or yield surprise may fail immediately.
Common rules for a grain MACD strategy
There is no single correct rule set, but experienced traders often use structures like these:
- Take bullish signals only when price is above a rising medium-term moving average.
- Take bearish signals only when price is below a falling medium-term moving average.
- Avoid new positions immediately before major USDA reports unless the strategy is specifically built for event risk.
- Require a breakout above resistance or below support in addition to the MACD crossover.
- Use contract volume and open interest to avoid thin or expiring markets.
- Roll to a more active contract month before liquidity deteriorates.
In grains, sideways conditions are a classic MACD problem. Corn, wheat, and soybeans can spend weeks in broad ranges while the indicator flips repeatedly. That is why many traders combine MACD with price action and seasonal context rather than trading every signal mechanically.
Main risks and limitations
MACD is a lagging indicator because it is based on moving averages. By the time it confirms a move, a meaningful part of the price change may already have occurred. In grains, this lag becomes especially important when weather fear, export policy changes, or crop-report surprises create gaps or sharp one-day moves.
Other important limitations include:
- Whipsaw risk: frequent false signals in non-trending markets.
- Event risk: USDA reports, weather model shifts, and geopolitical trade news can overwhelm technical setups.
- Leverage risk: futures require margin, and losses can exceed expectations if position size is too large.
- Basis risk: a futures hedge timed with MACD may not match changes in local cash basis.
- Contract risk: nearby and deferred grain contracts can behave differently because of carry, storage, and spread dynamics.
For physical grain businesses, another limitation is that technical indicators do not capture grain quality. Test weight, moisture, protein, falling number, damage, and dockage can significantly affect the real-world sale price, especially for wheat, rice, malting barley, and food-grade markets.
Best practices for using MACD in grain markets
The strongest use of MACD in grain markets is as one tool inside a disciplined process. That process should separate financial trading decisions from physical grain merchandising decisions even when the two are related.
- Use liquid benchmark contracts. Illiquid contracts can distort signals and execution.
- Check the crop calendar. Planting, pollination, harvest, and South American weather windows often influence momentum quality.
- Respect report dates. USDA and positioning data can change sentiment quickly.
- Compare futures with basis. Especially important for farmers and elevators.
- Back-test carefully. Include realistic rollover, slippage, and periods of sideways trade.
- Define risk before entry. Stops, max daily loss, and position size are not optional in leveraged markets.
A trader focused on grain futures may use MACD to time entries in corn or soybeans, while a commercial hedger may use the same signal simply to decide whether to scale hedge orders today or wait for better momentum confirmation. The indicator is useful, but only when matched to the user’s objective.
Where can I check grain futures prices for a MACD strategy?
Grain futures prices are typically checked through exchange data, futures broker platforms, and professional or retail charting software. CME Group is a primary reference for contract specifications and benchmark grain futures information. For actual trading, a funded futures brokerage account is normally required.
Where do farmers check the cash price instead of the futures chart?
Farmers usually check local cash bids from elevators, cooperatives, grain merchants, processors, or feed mills. These bids reflect futures plus or minus basis and may also include location, freight, and quality adjustments. A bullish MACD signal in futures does not guarantee a strong local cash bid.
Can MACD be used for physical grain buying and selling?
Yes, but indirectly. Physical grain is bought and sold through contracts with elevators, merchants, mills, processors, exporters, or feed buyers, not through a chart indicator alone. MACD can help with timing, but the actual physical decision must include basis, delivery point, quality standards, storage, and payment terms.
Is a MACD crossover enough to trade corn, wheat, or soybeans?
No. In grain markets, MACD works better when combined with trend analysis, support and resistance, volume, seasonal context, and key reports such as USDA WASDE or Crop Progress. On its own, it can produce many false signals in sideways conditions.
What is the difference between trading grain futures and buying actual grain?
Trading grain futures means taking a position in a standardized exchange contract through a broker, with margin and leverage. Buying actual grain means negotiating a physical transaction with a commercial counterparty such as an elevator, merchant, processor, or mill. Futures are financial instruments; physical grain involves logistics, quality, delivery, and settlement terms.
Which reports matter most when using MACD in grain markets?
The most important public reports often include USDA WASDE, Crop Progress, Export Sales, Grain Stocks, and Prospective Plantings, with CFTC Commitments of Traders useful for positioning context. These reports help explain whether momentum is likely to continue or reverse.
What are the biggest risks of a grain MACD trading strategy?
The biggest risks are whipsaws in sideways markets, sudden report-driven reversals, leverage from futures margin, and confusion between futures signals and local physical market conditions. Poor contract selection near expiry can also create avoidable execution problems.
Sources
- CME Group
- United States Department of Agriculture
- U.S. Commodity Futures Trading Commission