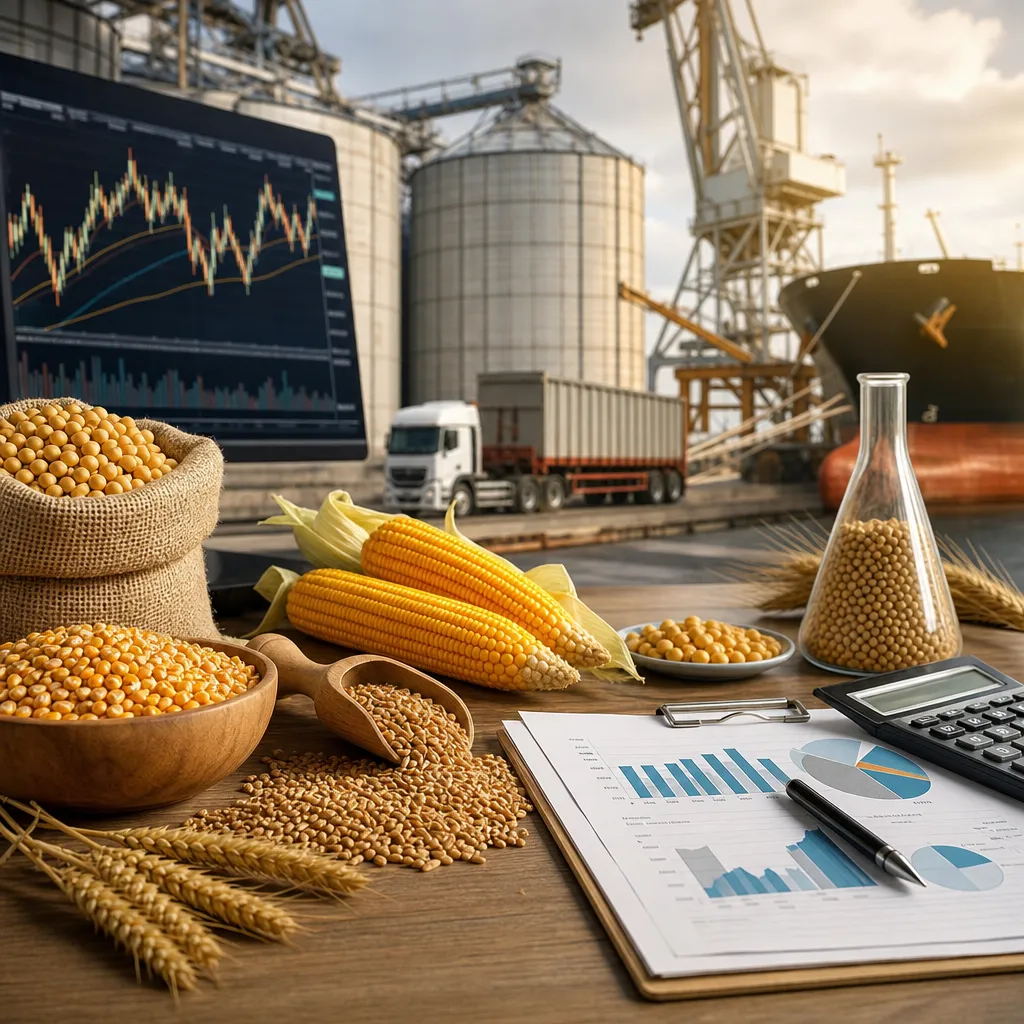







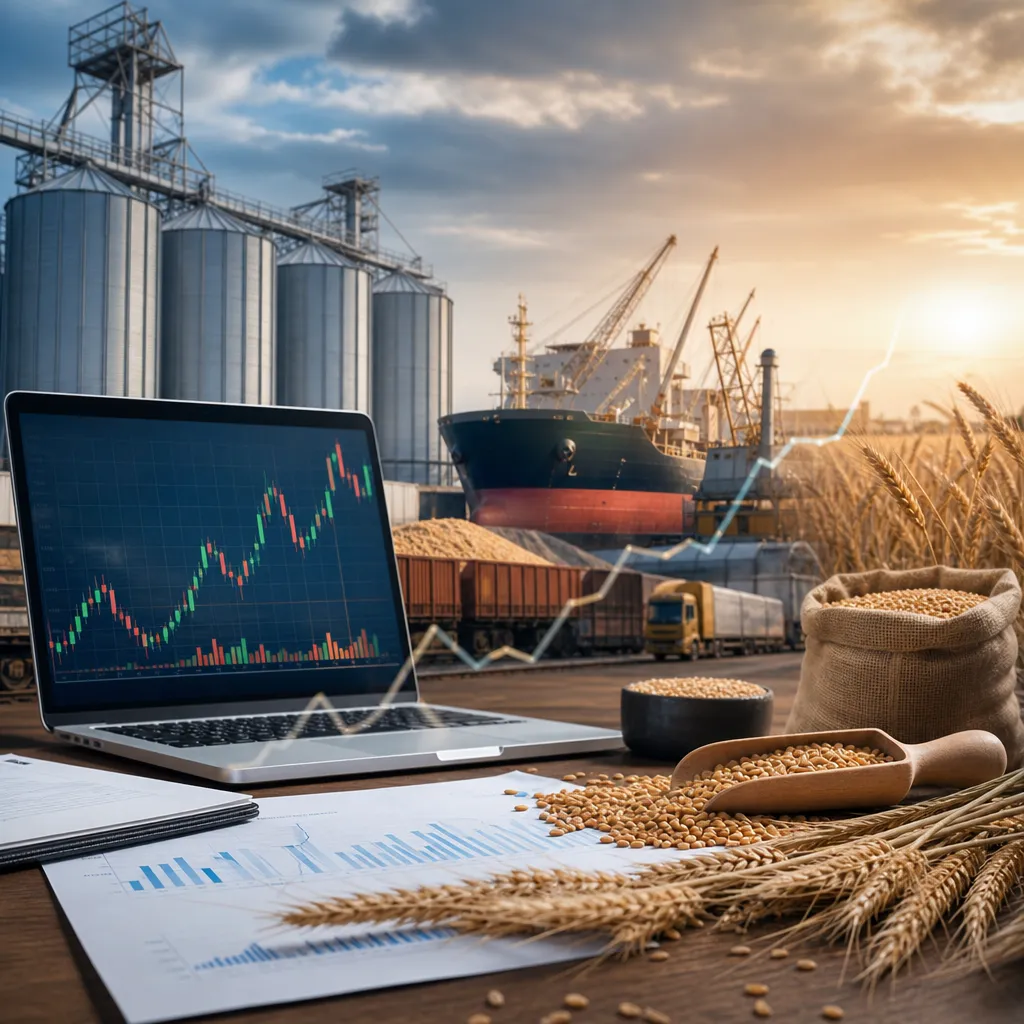
Wheat price history is the record of how wheat values have changed over time in both exchange-traded futures markets and the physical cash market. It matters because wheat prices influence farm revenue, flour and feed costs, food inflation, trade flows, storage decisions, and hedging strategy. To understand wheat prices properly, a reader must separate benchmark futures prices from local elevator bids, export values, and delivered mill prices. The most reliable way to study wheat price history is to combine exchange data, government market reports, and local cash market information rather than relying on a single quote.
In practice, wheat does not have one universal price. There are different classes of wheat, different delivery locations, different currencies, and different contract months. A Chicago futures chart may show broad market direction, but the price paid to a farmer at a local elevator depends on basis, freight, quality, moisture, protein, storage conditions, and local supply-demand conditions.
What wheat price history actually measures
When people refer to wheat price history, they may mean one of several things. The distinction is essential because each series answers a different commercial question.
- Futures price history: benchmark prices traded on a regulated commodity exchange, usually for a standardized contract.
- Cash price history: historical bids paid in a physical market by elevators, cooperatives, mills, feed companies, merchants, or exporters.
- Export price history: values of wheat sold into international trade, often influenced by freight, port capacity, and quality specifications.
- Farmgate price history: what producers actually received locally after basis and logistics adjustments.
- Retail or wholesale flour price history: downstream prices after processing and distribution.
For market analysis, the most common benchmark is futures history. For selling grain, local cash bid history is more useful. For policy and trade analysis, official farm price, export price, and production data often matter more than intraday exchange charts.
Where wheat prices are quoted and how the market is structured
Wheat prices exist in two connected but different markets: the financial market for futures and options, and the physical market for actual grain movement.
In the futures market, wheat contracts are traded on regulated exchanges. The best-known US benchmark is at CME Group, where different wheat contracts represent specific contract specifications and delivery terms. These contracts are used by hedgers and speculators through futures brokers. A trader does not need to own physical wheat to trade a futures contract, but the contract is tied to a deliverable grain specification.
In the physical market, wheat is bought and sold through grain elevators, agricultural cooperatives, merchants, millers, feed manufacturers, exporters, importers, and processors. Transactions may be spot sales, forward contracts, basis contracts, or other negotiated arrangements. The final cash price depends on the futures reference, the basis, quality premiums or discounts, and freight to the delivery point.
| Market type | What the price represents | Where it is found | Who uses it |
|---|---|---|---|
| Futures market | Standardized exchange-traded benchmark for a contract month | Exchange data, broker platforms, market-data services | Hedgers, traders, analysts, funds |
| Local cash market | Actual bid at a specific location for physical grain | Elevator bid sheets, cooperative apps, merchant quotes | Farmers, local buyers, feed mills |
| Export market | Port or shipment value for international trade | Export tenders, market reports, merchant indications | Exporters, importers, trade analysts |
| Farmgate reported price | Average producer price collected by agencies | Government statistics and agricultural reports | Economists, policymakers, researchers |
How wheat price history has typically behaved over time
Wheat price history is marked by long periods of relative stability interrupted by sharp rallies and sudden breaks. The market is highly sensitive to supply shocks because wheat is a major staple crop and inventories are not evenly distributed by country, wheat class, or export quality.
Historically, wheat prices tend to react strongly to:
- Weather risk, especially drought, excessive rain, heat, freeze damage, and harvest disruption.
- Global stocks, particularly when stocks-to-use ratios tighten.
- Export restrictions or policy shifts by major producing or exporting countries.
- War or transport disruption, especially around key Black Sea export routes.
- Currency moves, which affect export competitiveness.
- Competition with corn in feed rations and with other crops in acreage decisions.
- Input costs, such as fertilizer, diesel, and financing.
Seasonality also matters. Prices often respond to planting conditions, winter survival, spring crop ratings, and Northern Hemisphere harvest pressure. That does not mean prices always fall at harvest or rise in weather scares, but those are common periods of volatility. Historical charts are useful only when paired with crop calendar context and stock data.
What usually drives major changes in wheat prices
Wheat is a global commodity, but local prices can move for local reasons. A region with full bins, rail congestion, or weak milling demand may see soft cash bids even when futures are firm. Likewise, a protein shortage or port demand surge can strengthen basis while futures are flat.
| Driver | Typical effect on price history | How people check it |
|---|---|---|
| Weather and crop condition | Can trigger rapid rallies or declines as yield expectations change | Crop reports, weather models, field surveys |
| World production and stocks | Shapes medium-term trend and scarcity perception | USDA WASDE, national statistics, trade balance data |
| Export demand | Supports prices when major buyers are active | Export sales reports, tender results, shipment pace |
| Basis and freight | Moves local cash history independently of futures | Local elevator bids, barge and rail conditions, port demand |
| Government policy | Can reprice export availability quickly | Official ministry notices, customs policy updates |
For practical use, analysts often divide wheat price history into three layers:
- World balance sheet layer: stocks, production, and trade.
- Regional basis layer: freight, storage, and local demand.
- Quality layer: protein, test weight, moisture, falling number, and contamination issues.
This layered approach explains why two wheat prices can move differently at the same time.
Where to find wheat price history online
Reliable wheat price history is available from a combination of exchange, government, and commercial sources.
CME Group is the primary reference point for US-traded wheat futures history. It provides contract information, delayed market data, and settlement-related information. Futures history from an exchange is the correct source when the goal is to study benchmark price trends, contract spreads, volatility, or hedging behavior.
USDA provides some of the most important public grain market reports. Depending on the dataset, readers can find farm prices, export sales, world supply and demand estimates, crop progress, production history, and grain transportation indicators. These are essential for explaining why wheat prices moved, not just observing that they moved.
CFTC data is useful for understanding market positioning in US futures. Its Commitments of Traders reports show how different trader categories are positioned. This does not predict price by itself, but it helps analysts interpret whether rallies or declines are associated with heavy fund participation or commercial hedging.
For local cash history, farmers usually check:
- elevator and cooperative bid pages,
- merchant or processor bid sheets,
- mobile apps used by local grain buyers,
- regional agricultural market reporting services,
- state or provincial extension and market news channels where available.
These sources are more relevant than exchange charts when a producer wants to know what could have been sold at a specific location. Not every buyer publishes long historical bid records, so farm management software or self-kept sales records may be needed for a complete local history.
How wheat price history is used in farming, trading, and procurement
Farmers use wheat price history to evaluate when to make cash sales, hedge production, store grain, or forward contract next crop. They compare current bids to historical seasonal patterns, storage costs, and expected basis improvement. A historical chart alone is not enough; the decision also depends on carry, interest cost, shrink risk, and grain quality maintenance.
Millers, feed companies, and processors use wheat price history to plan procurement. They may compare nearby cash needs with futures curves, basis patterns, and substitute grain economics. Their focus is often not the absolute price level alone but price relative to flour demand, feed margins, and freight availability.
Traders use wheat price history for:
- trend analysis,
- spread analysis between contract months,
- inter-market analysis versus corn or other wheat classes,
- volatility assessment for options pricing,
- event studies around reports such as WASDE or Crop Progress.
Researchers and policymakers use long-run wheat price history to study food security, inflation transmission, and the effects of weather, trade barriers, and supply shocks.
Futures history versus physical wheat history
A common mistake is to treat futures price history as if it were identical to physical wheat history. Futures are standardized benchmarks. Physical wheat is a real commodity that must meet grade and delivery conditions and must be stored, transported, inspected, and paid for.
To trade futures, a participant normally needs a futures brokerage account and access to a regulated platform routed to the exchange. This is financial trading and involves margin, daily mark-to-market, and leverage. Gains and losses can exceed initial expectations because small price moves affect the full contract value.
To buy or sell physical wheat, the transaction usually occurs through an elevator, merchant, cooperative, mill, feed buyer, broker, or exporter. The parties must agree on quantity, grain class, grade, moisture, protein if relevant, delivery period, delivery point, freight responsibility, and payment terms. A physical buyer may hedge futures exposure separately, but the physical contract itself is a grain movement agreement rather than a speculative exchange position.
History in the physical market is therefore affected by commercial terms that do not appear on a simple chart. Basis records, grade discounts, storage charges, drying costs, and logistics bottlenecks often matter as much as the benchmark futures trend.
How to analyze wheat price history correctly
The best practical method is to build analysis from benchmark to local detail.
- Start with the benchmark futures series for the relevant wheat contract and contract month.
- Add major fundamental reports such as world supply-demand estimates, production revisions, and export sales.
- Compare with local basis history at the elevator, cooperative, or processor actually used.
- Adjust for wheat class and quality, especially where protein or milling characteristics create premiums.
- Include logistics context such as rail availability, river conditions, port congestion, or harvest speed.
- Measure storage economics before assuming a later sale would have been better.
This method helps avoid a common hindsight error: seeing a higher futures price later and assuming storage was the obvious choice, even if local basis weakened or carrying costs erased the gain.
Readers analyzing international markets should also check currency history. Wheat traded internationally may be benchmarked in US dollars, but a producer or importer experiences the price in local currency. Exchange-rate changes can materially alter the real price history seen by farms or buyers.
Practical limits of historical wheat prices
Historical prices are useful, but they are not a forecast. A repeated seasonal pattern can fail when world stocks change, a drought develops, policy shifts, or freight is disrupted. Historical data can also be misleading if the wrong series is used.
Main limitations include:
- Contract roll issues in continuous futures charts.
- Differences between wheat classes such as soft, hard, spring, or durum markets.
- Local basis variation that makes national averages less useful for farm decisions.
- Quality variation that changes actual realized cash prices.
- Inflation and currency effects when comparing long time periods.
- Storage and financing costs that are not visible in nominal price charts.
For serious commercial use, historical wheat prices should be treated as one tool among several, alongside current bids, crop reports, weather information, transportation conditions, and balance-sheet analysis.
Where can I check wheat price history reliably?
For futures benchmarks, exchange-related data from CME Group is the main reference. For underlying market explanation, USDA reports such as WASDE, Crop Progress, and Export Sales are widely used. For local cash history, the best source is usually the elevator, cooperative, processor, or merchant serving the delivery area.
Is wheat futures history the same as the price farmers receive?
No. Futures history is a benchmark for a standardized exchange contract. Farmers are usually paid a local cash price, which equals the relevant futures reference plus or minus basis, then adjusted for quality, moisture, freight, and any applicable discounts or premiums.
Where does physical wheat buying and selling usually happen?
Physical wheat is commonly traded through grain elevators, cooperatives, grain merchants, mills, feed manufacturers, exporters, and brokers. Transactions may be made by phone, email, contract portal, or in-person commercial relationships, but the grain still has to move to a real delivery point.
Can I trade wheat price history online without buying real grain?
Yes, but that means trading futures or options through a regulated broker, not buying physical wheat. This requires a brokerage account, involves margin and leverage, and carries substantial risk. It is different from delivering truckloads of grain to an elevator or warehouse.
What reports help explain changes in wheat price history?
USDA WASDE helps with world supply and demand. USDA Crop Progress helps track crop condition and planting or harvest pace. USDA Export Sales helps measure demand. CFTC Commitments of Traders helps interpret futures positioning. Together, these reports provide context for why prices moved.
Why do local wheat bids sometimes fall when futures rise?
This usually happens because basis weakens. Reasons may include harvest pressure, limited storage space, weak local demand, freight problems, or quality concerns. A rising futures market does not guarantee a stronger cash bid at a specific elevator.
What is the most useful historical series for a farmer?
Usually a combination of local cash bid history and basis history, plus the relevant futures series. That combination shows not only broad market direction but also what was actually available at the farm’s normal delivery points.
Sources
- USDA World Agricultural Supply and Demand Estimates
- CME Group agricultural futures contract information and market data
- U.S. Commodity Futures Trading Commission Commitments of Traders