The integration of satellite technology into grain production has transformed how farmers, agronomists, and market analysts forecast harvest outcomes. By leveraging remote sensing tools and advanced modeling techniques, stakeholders can now monitor crop development in near real time, adjust management strategies on the fly, and anticipate market shifts with unprecedented accuracy. This article explores the pivotal role of satellite data in refining yield predictions, examines the technological processes behind these insights, and highlights implications for the global agricultural markets.
Understanding Satellite Data Applications in Grain Cultivation
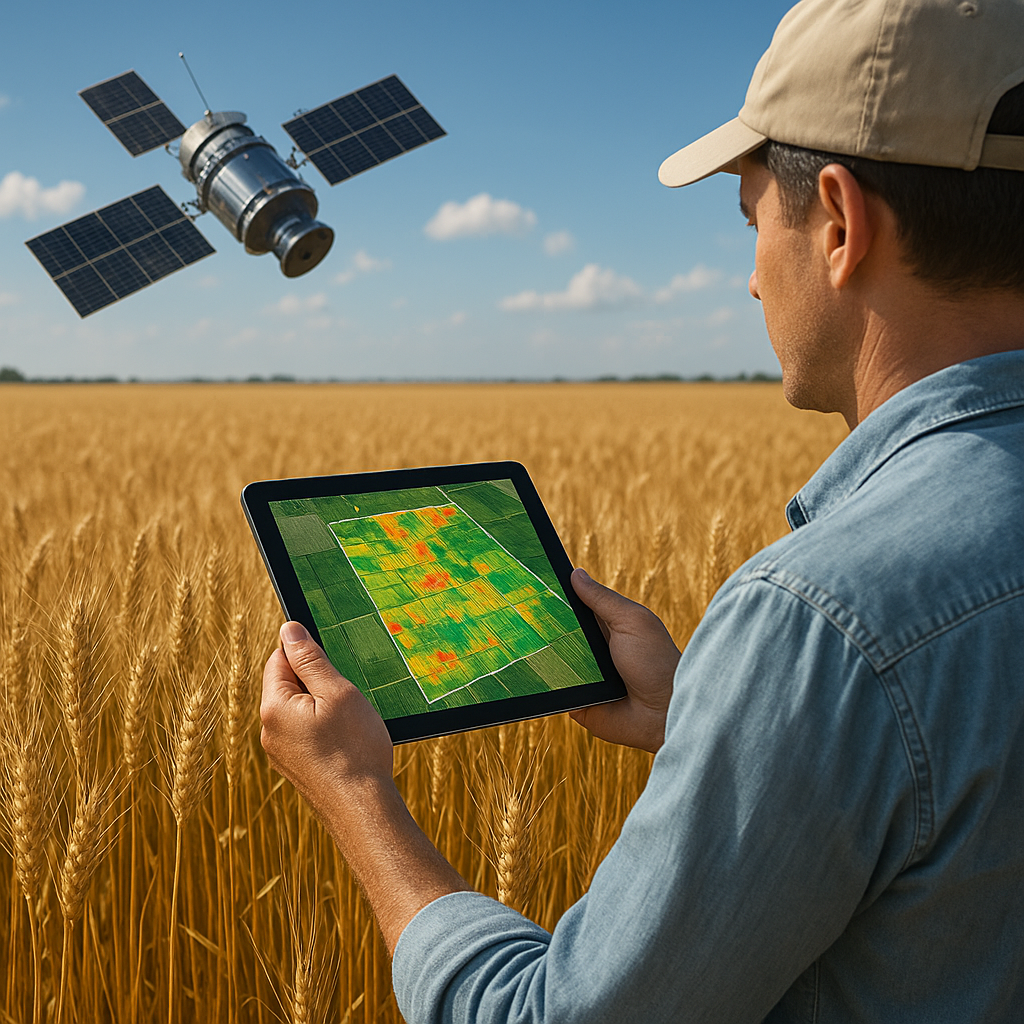
Modern satellites collect a wealth of information about terrestrial vegetation, capturing reflected light across various spectral bands. When applied to grain fields, these data provide a window into plant health, soil conditions, and water stress, enabling early identification of potential yield-reducing factors.
Key Spectral Indicators
- NDVI (Normalized Difference Vegetation Index): Measures the difference between near-infrared and red light reflectance to assess biomass and chlorophyll content.
- Multispectral Bands: Include green, blue, red, and near-infrared channels, each revealing specific aspects of crop physiology and soil background.
- Thermal Infrared: Captures canopy temperature variations, an indicator of plant water stress and evapotranspiration rates.
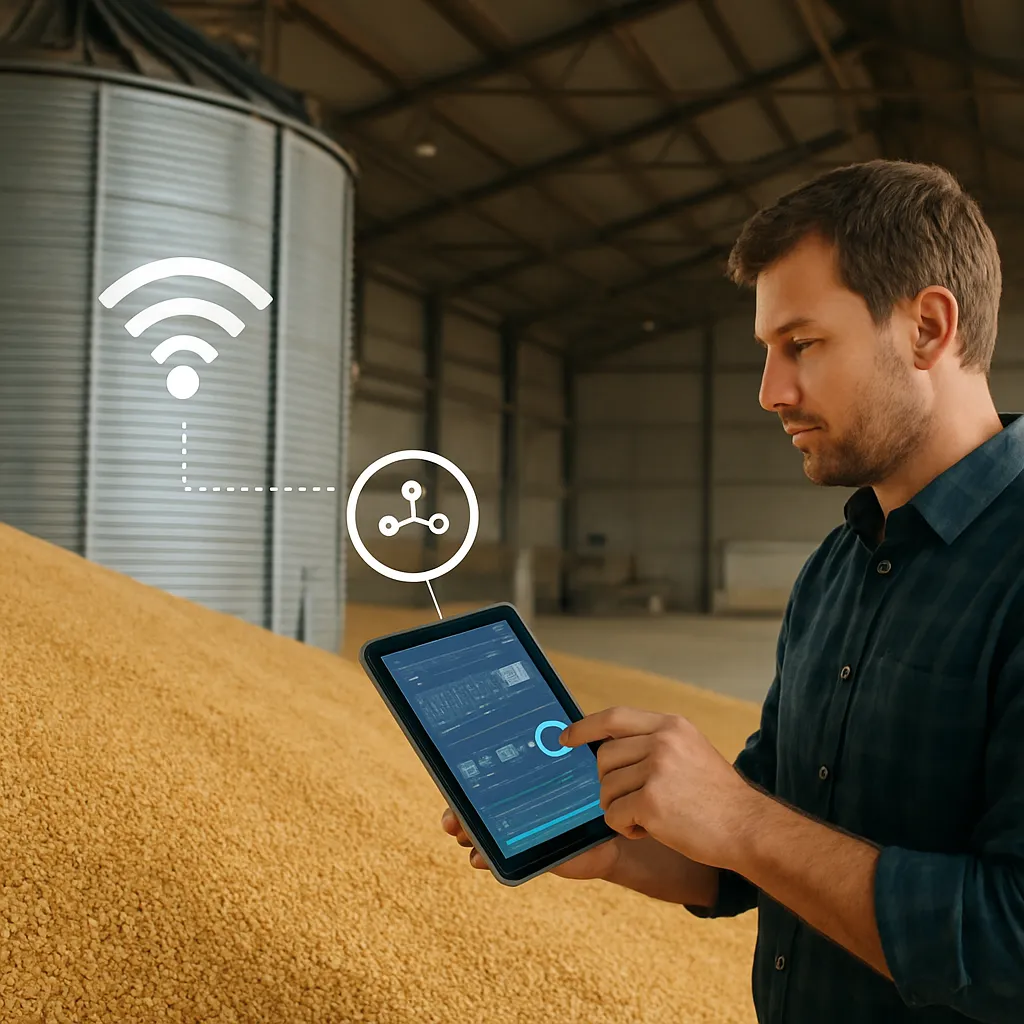
Data Acquisition and Processing
Satellites such as Sentinel-2, Landsat 8, and commercial constellations continuously orbit the Earth, generating frequent revisit intervals. Raw imagery undergoes several preprocessing steps:
- Radiometric Correction: Adjusts for sensor calibration and atmospheric interference.
- Geometric Correction: Aligns images with geographic coordinates to ensure spatial accuracy.
- Cloud Masking: Filters out clouds and shadows to reduce noise in time-series analyses.
After these corrections, algorithms extract vegetation indices and thermal data, which feed into predictive analytics models.
Enhancing Grain Yield Predictions with Advanced Modeling
Integrating satellite-derived metrics with environmental and management data enables the construction of robust forecasting models. These models combine statistical techniques and machine learning to translate remote sensing observations into yield estimates.
Combining Data Sources
- Weather Records: Historical temperature, precipitation, and solar radiation trends.
- Soil Maps: Texture, organic matter content, and nutrient status obtained from ground surveys or proximal sensors.
- Management Logs: Planting dates, fertilizer applications, and irrigation schedules documented by farmers.
By fusing these layers with remote sensing inputs, models gain a comprehensive perspective on the factors driving crop performance.
Modeling Techniques
- Time-Series Regression: Aligns vegetation index trajectories with known yield outcomes to establish empirical relationships.
- Random Forests and Gradient Boosting: Machine learning algorithms that identify complex, nonlinear interactions between predictors.
- Crop Growth Simulators: Mechanistic models (e.g., APSIM, DSSAT) that simulate phenological stages based on physiological rules and weather conditions.
Hybrid approaches—blending mechanistic and data-driven frameworks—often deliver the highest predictive accuracy. For instance, a model may use a crop simulator to set baseline growth and then adjust forecasts with real-time satellite observations of canopy vigor.
Operational Benefits for Farmers and Stakeholders
Precision monitoring of crop conditions empowers decision-makers at multiple levels. From on-farm management to global commodity trading, the ability to anticipate yields fosters more efficient allocation of resources and risk mitigation.
Field-Level Management
- Variable-Rate Applications: Satellite maps highlighting nitrogen deficiency enable targeted fertilizer delivery, reducing costs and environmental impact.
- Drought Response: Early detection of water stress zones through thermal imaging supports timely irrigation scheduling.
- Pest and Disease Surveillance: Abnormal reflectance patterns can indicate pest outbreaks or disease onset, prompting rapid intervention.
Regional and National Forecasting
- Government Agencies: Use aggregated satellite metrics to refine crop outlook reports and inform policy decisions.
- Commodity Traders: Adjust price forecasts based on real-time updates of crop health across major production regions.
- Insurance Providers: Develop parametric insurance products that trigger payouts when satellite indicators fall below predefined thresholds.
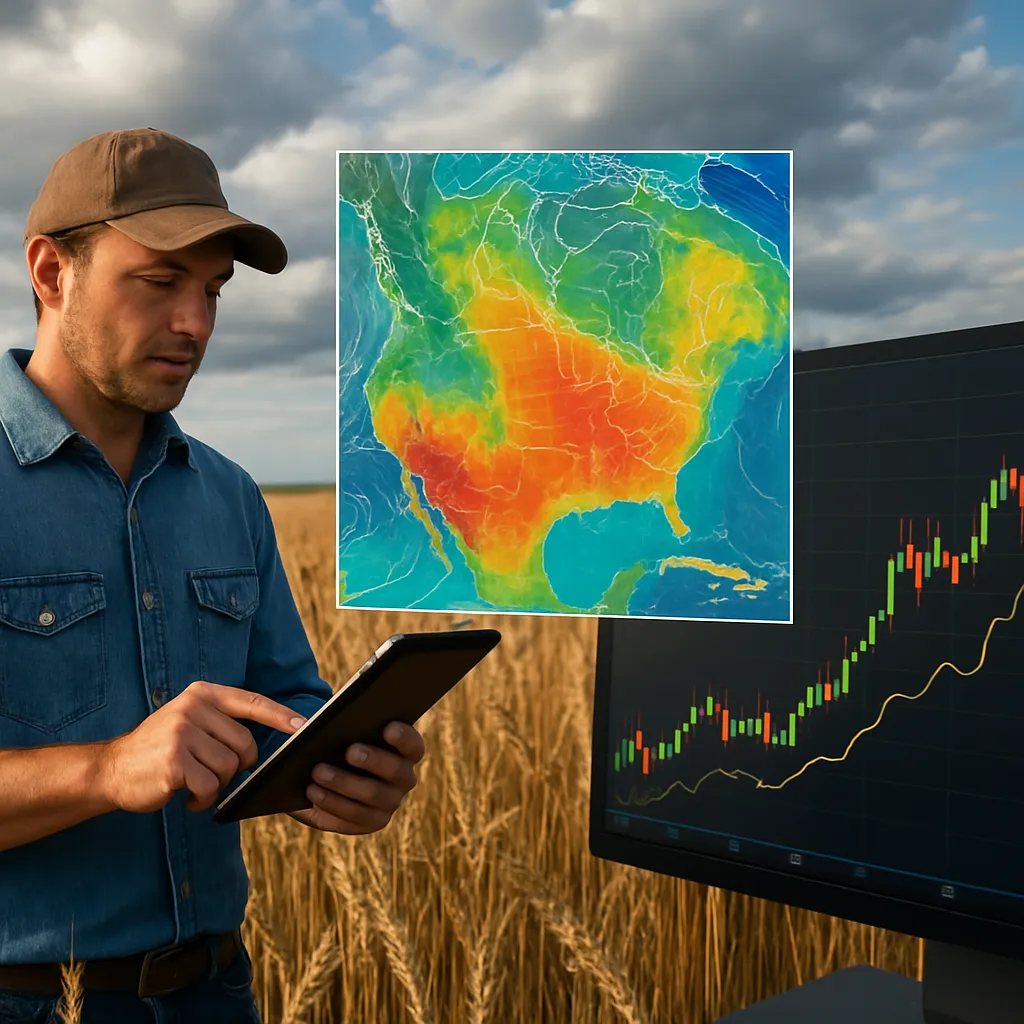
Market Dynamics and Economic Implications
Enhanced yield predictions inform supply chain actors, reduce uncertainty, and contribute to more stable market prices. By narrowing the gap between projected and actual harvest volumes, stakeholders can optimize logistics, storage, and trading strategies.
Price Volatility Reduction
Timely insights into crop prospects dampen speculative spikes. When traders receive accurate weekly updates on vegetative vigor and rainfall patterns across key grain belts, extreme price swings become less frequent.
Supply Chain Coordination
- Logistics Planning: Grain handlers and exporters can schedule shipments based on anticipated volumes, preventing bottlenecks at ports and elevators.
- Storage Management: Granaries allocate space more efficiently, reducing spoilage risks and overcapacity.
- Contract Negotiations: Improved yield forecasts inform forward contracting, enabling farmers to secure better prices and buyers to lock in supply.
Future Trends in Satellite-Driven Agriculture
Technological advancements and expanding data sources promise to further refine yield estimation and market forecasting capabilities.
- Data Integration: Merging high-resolution satellite imagery with drone surveys and IoT sensor networks for multi-scale crop monitoring.
- Artificial Intelligence: Deploying deep learning models to detect subtle stress signals undetectable by traditional indices.
- Ubiquitous Coverage: Small satellite constellations delivering daily or even hourly revisits for dynamic crop tracking.
- Climate Variability Monitoring: Long-term time-series aiding in the assessment of climate variability impacts on production resilience.
- Blockchain-enabled Traceability: Linking yield data with supply chain records to assure quality and origin for consumers.
Conclusion
Satellite-based monitoring has become an indispensable component of precision agriculture and crop management strategies. By combining spectral information with weather, soil, and management data, stakeholders can generate highly accurate grain yield forecasts that drive more informed decisions across the value chain. As data acquisition becomes more frequent and analytical methods more sophisticated, the grain sector stands to benefit from enhanced productivity, reduced risk, and more stable agricultural markets.