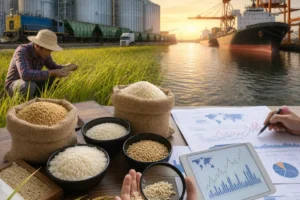
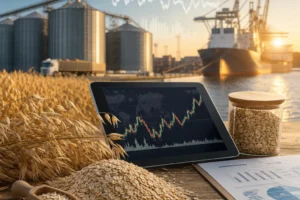
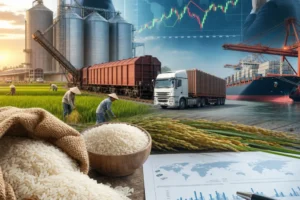
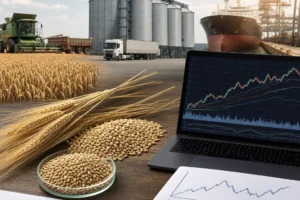

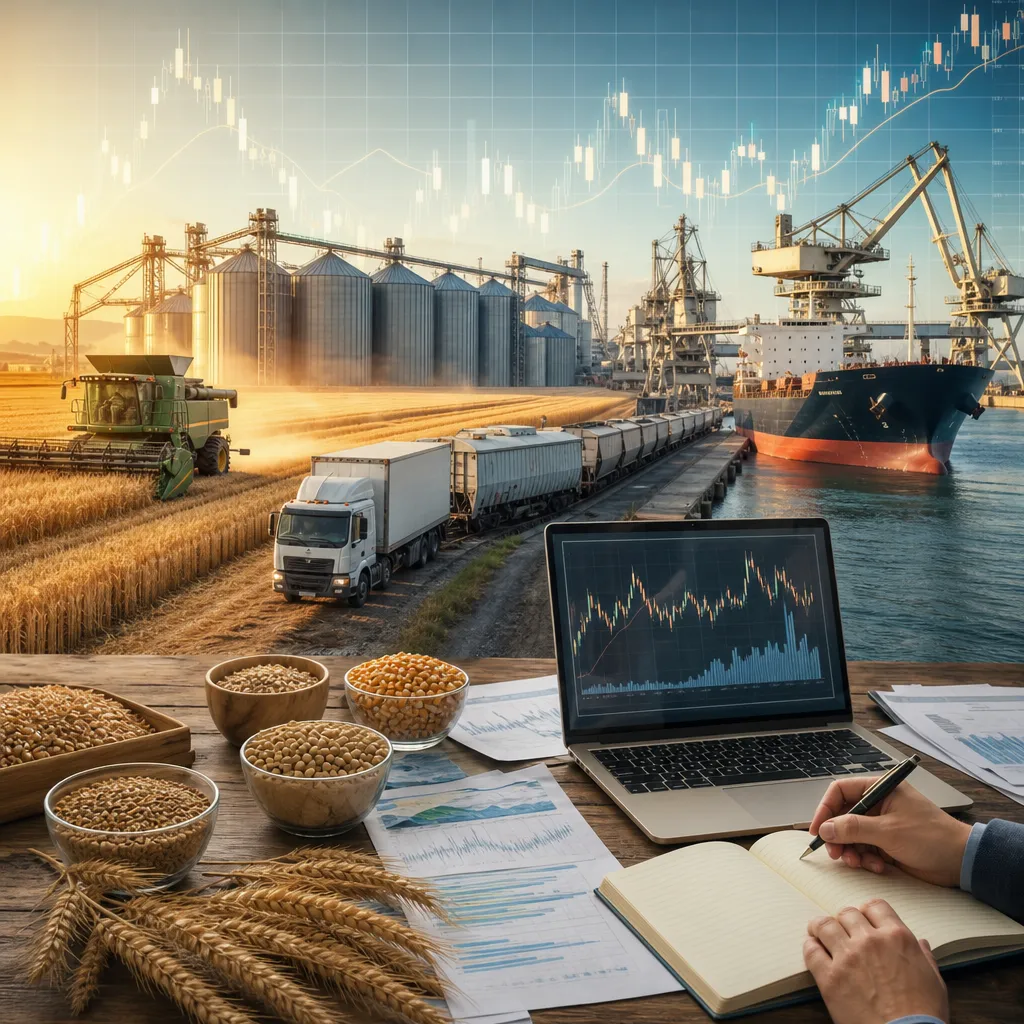
Grain price history is the record of how values for wheat, corn, soybeans, rice, barley, oats, rye, sorghum, canola, rapeseed, and related crops have changed over time in both exchange markets and physical cash markets. It matters because historical prices help farmers decide when to sell, buyers decide when to cover needs, traders test strategies, and analysts explain how weather, policy, exports, stocks, and freight affected the market. The most important practical point is that there is no single “grain price history”: futures history from exchanges and local cash bid history from elevators or merchants are different datasets. To use grain price history correctly, a reader must know which market the price came from, what unit it uses, where delivery would occur, and whether the series reflects futures, basis, or actual physical cash transactions.
What grain price history actually includes
Grain price history usually appears in three main forms. Each serves a different purpose, and confusing them leads to poor decisions.
- Futures price history: Exchange-traded contracts such as corn, wheat, or soybean futures. These are standardized contracts traded on regulated exchanges, commonly used for price discovery and hedging.
- Cash price history: Local bids or transaction prices offered by elevators, cooperatives, processors, feed mills, exporters, or merchants in a specific region.
- Basis history: The difference between a local cash price and the relevant futures contract. Basis reflects local supply-demand, freight, storage pressure, quality differences, and nearby logistics.
For example, a corn futures chart may show a major rally, while a farmer’s local elevator bid rose less because basis weakened during harvest. That is why historical grain analysis normally requires both exchange and local market data.
| Price type | What it measures | Where to find it | Who uses it |
|---|---|---|---|
| Futures history | Standardized exchange contract prices over time | Commodity exchanges, broker platforms, market-data vendors | Traders, hedgers, analysts, processors |
| Cash bid history | Local buying prices at delivery points | Elevators, cooperatives, merchants, processors, reporting services | Farmers, local buyers, merchandisers |
| Basis history | Local cash minus futures | Grain merchandisers, farm marketing software, internal elevator records | Farm marketers, hedgers, elevators |
| Export market history | Values at ports or origin/export channels | Government export data, port market reports, merchants | Exporters, importers, analysts |
Where grain price history is found online
The most widely used source for regulated futures price history is the exchange that lists the contract or a licensed market-data service that redistributes it. For U.S. grain futures, CME Group is central because it lists major corn, soybean, soybean meal, soybean oil, wheat, oats, rough rice, and canola-related contracts through its markets. Historical futures information may also appear through brokerage platforms and charting software, but users should verify whether the data is delayed, settlement-based, or intraday.
For public market information, government agencies are essential. The U.S. Department of Agriculture publishes cash market information, production reports, stocks, export sales, and crop progress that help explain why prices moved. National agricultural ministries and statistical agencies in other countries may publish farmgate, wholesale, or export price series for local markets.
Readers typically use these categories of sources:
- Exchanges for official futures contract specifications, settlement history, and expiry information.
- Futures brokers for charting, account-based market access, and historical contract views.
- Government reporting systems for regional cash prices, grain inspections, exports, and crop data.
- Commercial data vendors for cleaned historical databases, analytics, APIs, and cross-market comparisons.
- Local elevators and cooperatives for current and sometimes archived local bids.
Not all data is equally accessible. Futures history is often easier to obtain than long local cash bid history. Many local elevators display current bids online or through mobile apps, but only some retain public multi-year archives. In practice, farmers often build their own local history by recording bids over time or using farm marketing software that stores basis and sales records.
How grain price history works in futures markets
Futures price history is built contract by contract. A corn futures series, for example, may consist of separate delivery months such as March, May, July, September, and December. Each contract has its own trading life, expiry, and delivery rules. That means a long-term chart can be shown in two ways: as an individual contract month or as a “continuous” series rolled from one contract to the next.
This matters because continuous charts are useful for long-term analysis but may include roll adjustments that slightly change the visual pattern. A trader testing seasonality or technical signals should verify how the series was constructed. A hedger, by contrast, often needs the actual nearby or new-crop contract that matches the physical exposure.
To access futures history in practice:
- Identify the crop and relevant exchange contract.
- Choose the contract month or a continuous series.
- Check the unit of trading, currency, and delivery terms.
- Use exchange data, a broker platform, or a licensed market-data service.
- Compare futures with local basis before applying them to farm marketing or procurement.
Futures trading itself takes place through a regulated exchange, but most users access it through a futures commission merchant or broker. Opening a futures account is different from selling grain physically. It involves financial margin, leverage, and risk controls. Buying or selling a futures contract does not mean grain will automatically move unless the contract is held into delivery and the participant is eligible and positioned to make or take delivery under exchange rules.
How cash grain price history works in the physical market
Physical grain price history is more fragmented because grain is bought and sold at thousands of locations under varying quality, freight, moisture, and delivery conditions. A local bid is usually a cash price at a named delivery point, often an inland elevator, river terminal, processor, feed mill, flour mill, ethanol plant, crush plant, or export elevator.
The transaction flow typically works like this:
- A farmer, collector, or merchant offers grain for sale.
- An elevator, cooperative, processor, feed company, or exporter quotes a bid.
- The price is based on a futures reference plus or minus local basis, or on a flat cash price.
- The contract specifies quality, quantity, delivery period, moisture limits, and discounts if applicable.
- Freight, storage status, and payment terms affect the final net price.
Historical local prices therefore depend on more than exchange direction. A region with harvest congestion, poor rail service, weak export demand, or quality issues may show weak basis even when futures are strong. In contrast, a processor short of supplies may post historically strong basis when nearby grain is scarce.
Where can readers actually check this history? In practice, they look at:
- Local elevator and cooperative bid sheets
- Processor procurement pages
- Agricultural market reporting services run by governments or states
- Merchant and broker reports for regional physical markets
- Internal records from prior contracts, settlement sheets, and scale tickets
Because physical grain is location-specific, historical price comparisons work best when the same delivery point and quality standard are used throughout the analysis.
| Market | How price is formed | Where transaction happens | Main limitation |
|---|---|---|---|
| Futures | Exchange order book and standardized contracts | Regulated commodity exchange via broker | Not the same as local farmgate price |
| Local cash | Bid by elevator, processor, merchant, or buyer | Physical delivery point or direct contract | Harder to find long public history |
| Basis | Cash minus futures | Calculated from both markets | Can shift quickly with logistics and local demand |
| Export physical | Negotiated cargo or terminal values | Port, export terminal, or merchant contract | May reflect freight and trade terms not relevant inland |
What drives changes in grain prices over time
Grain price history is a record of changing supply, demand, and risk. The same crop can trade very differently from one year to the next because the market constantly revalues expected availability and usage.
The main drivers include:
- Weather: Drought, excessive rain, heat stress, frost, and harvest delays can change yield and quality.
- Acreage and yields: Planting intentions and final production shape supply.
- Stocks and stocks-to-use: Tight carryout generally increases sensitivity to surprises.
- Exports and imports: Large tenders, policy changes, or port disruptions can move prices.
- Currency movements: A weaker exporter currency can improve competitiveness.
- Energy and biofuels: Corn and oilseed values often respond to ethanol, biodiesel, and energy markets.
- Freight and logistics: Rail issues, river levels, truck shortages, and port congestion affect basis.
- Government policy: Tariffs, quotas, sanctions, and subsidy programs can shift trade flows.
- Quality: Protein, test weight, moisture, oil content, or damage can separate one market from another.
In practical analysis, grain users rarely look at price history alone. They pair it with report history and seasonal context. A price chart without acreage, crop-condition, stocks, and export data can be misleading.
Which reports and datasets are most useful
Several official reports are repeatedly used to interpret grain price history. These do not replace price data, but they explain why major turning points occurred.
- USDA WASDE: Global and U.S. supply-demand balance sheets for major crops. Widely used to track production, use, exports, imports, and ending stocks.
- USDA Crop Progress: Weekly updates on planting, condition, and harvest pace in the United States.
- USDA Grain Stocks: Inventory estimates that can reshape old-crop and new-crop expectations.
- USDA Export Sales: Weekly export commitments and shipments for major commodities.
- CFTC Commitments of Traders: Positioning data showing how commercial and non-commercial participants are positioned in futures and options.
- FAO market and food commodity information: Useful for international context, especially outside a purely U.S. market view.
Farmers and buyers generally use these reports differently. Farmers often focus on basis, seasonality, and storage decisions around report dates. Traders may track volatility, positioning, and nearby versus deferred spreads. Importers and exporters pay particular attention to global balance sheets, tender activity, and port logistics.
How farmers, buyers, and traders use grain price history
Historical prices become useful when tied to a practical decision.
For farmers
Farmers use price history to compare pre-harvest bids, estimate storage carry, review basis patterns, and judge whether a current bid is attractive relative to prior years. Many compare harvest basis to post-harvest basis improvement before deciding whether on-farm storage is worth using.
For processors and feed buyers
Buyers use history to schedule coverage, monitor margin risk, and compare spot purchases with forward contracts. A feed mill may watch corn and wheat substitution patterns over time, while an oilseed crusher may compare bean values with meal and oil markets.
For traders and hedgers
Speculators may use historical volatility, seasonality, and spread behavior. Commercial hedgers use price history to measure hedge effectiveness and basis risk. A hedger is not trying to “beat the market” in the same way a speculator might; the objective is usually to reduce uncertainty on inventory, purchases, or future sales.
Anyone using historical prices for hedging should remember that futures hedge the benchmark, not every local cash risk. Basis can still move against the hedge.
Storage, logistics, and quality in historical grain prices
Some of the biggest mistakes in grain history analysis come from ignoring storage and logistics. Grain is bulky, seasonal, and expensive to move. A local cash market under harvest pressure can trade poorly even when the broader futures market is stable.
Key practical factors include:
- On-farm versus commercial storage: Carry opportunities only matter if storage losses, interest, and handling costs are covered.
- Freight: Truck, rail, barge, and ocean conditions reshape regional basis.
- Quality retention: Moisture, insects, mold, and aeration issues can reduce sale value over time.
- Delivery point: A processor bid may be better than a nearby elevator bid, but trucking distance can erase the gain.
- Discount schedules: Historical “price” is not enough if quality deductions changed the realized net return.
For physical users, the best history is often net delivered price or net farmgate return, not just the headline bid. That means accounting for freight, drying, shrink, storage, and discounts.
Common mistakes when checking grain price history
- Comparing futures from one month to cash bids from another period.
- Using a continuous futures chart without understanding roll methodology.
- Assuming a strong futures rally automatically improved local cash returns.
- Ignoring basis, freight, and quality discounts.
- Comparing prices quoted in different units or currencies without conversion.
- Using delayed or unofficial market data without checking the source.
- Testing a strategy on history that could not actually have been traded at the time.
Where can I check grain price history online?
You can normally check futures price history through commodity exchanges such as CME Group, through futures broker platforms, or through market-data vendors. Local cash history is usually found through elevators, cooperatives, processors, regional market reporting services, or your own past settlement records.
Is grain price history the same as futures price history?
No. Futures history shows standardized exchange contracts, while grain price history may also mean local cash bids, export values, or basis history. A farmer’s actual sale price is usually a cash market outcome, not a pure futures quote.
Where do farmers usually find local grain bids?
Farmers commonly check elevator and cooperative bid pages, processor procurement pages, merchant bid sheets, phone quotes from local buyers, and government or regional agricultural market reporting services. The bid should be checked with its delivery location and quality terms.
Can I trade grain price history directly?
You cannot trade past prices, but you can use historical data to test ideas or manage risk. If you want to trade financially, that normally happens in regulated futures or options markets through a broker. If you want to sell actual grain, that happens through physical buyers such as elevators, processors, merchants, or exporters.
Why does my local cash price differ from the exchange price?
Because local cash prices include basis. Basis reflects local supply-demand, freight, storage pressure, competition among buyers, and grain quality. The exchange price is only the benchmark component.
Which reports are most useful for understanding price history?
USDA WASDE, Crop Progress, Grain Stocks, and Export Sales are core reports for U.S.-linked grain markets. CFTC Commitments of Traders is useful for futures positioning, and FAO provides global context for international grain and food commodity markets.
What should I check before comparing prices across years?
Check the crop year, contract month, unit of measure, currency, delivery point, and whether the number is futures, basis, or cash. Also check whether quality standards changed or whether freight and drying costs were materially different.
Is long-term cash grain history always public?
No. Long futures history is often easier to access than long local cash history. Many physical market records are private, commercial, or only maintained by the elevator, merchant, cooperative, or farm business involved.
Sources
- USDA Agricultural Marketing Service
- CME Group
- U.S. Commodity Futures Trading Commission