





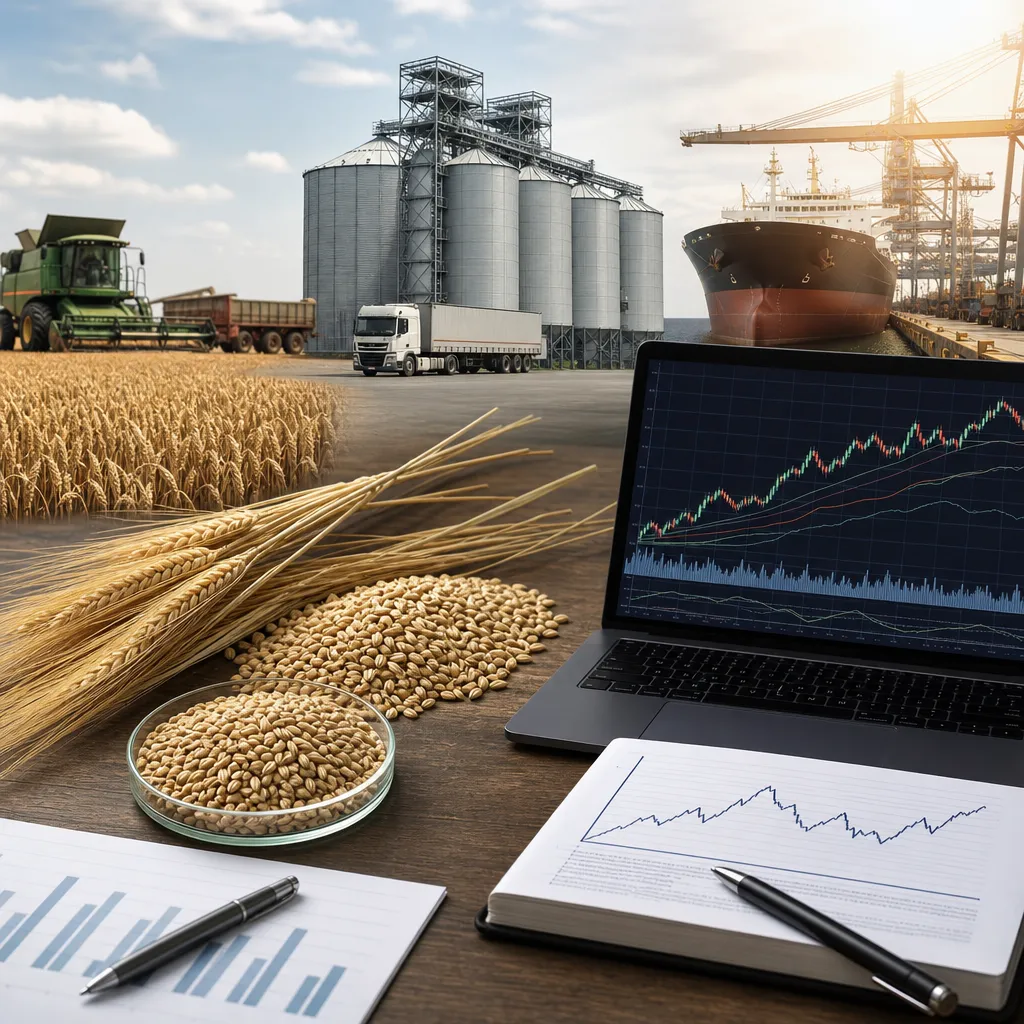
Barley price history is the record of how barley values have moved over time in local cash markets, export channels, and exchange-linked markets. To use that history properly, a reader must separate futures benchmarks from physical cash prices, because the price quoted on an exchange is not automatically the price paid at a local elevator, maltster, feed mill, or port. In practice, barley prices are checked through a mix of government market reports, exchange data, merchant bids, cooperative bid sheets, port indications, and farm marketing services. Understanding where those prices come from is the key to using barley history for farm decisions, hedging, procurement, storage, and trade analysis.
What barley price history actually measures
Barley is traded in more than one commercial form, so there is no single universal “barley price.” Historical prices may refer to feed barley, malting barley, specific protein ranges, specific test weights, or delivered values into export or domestic processing channels. A historical series only makes sense if the reader knows the grade, location, delivery basis, currency, and unit.
In physical grain trade, barley prices are usually shaped by:
- Local supply and yield
- Quality, especially for malting barley
- Competing feed grain prices, especially corn and wheat
- Freight to feed users, ports, or maltsters
- Export demand
- Currency moves in exporting and importing countries
- Storage costs and nearby harvest pressure
Unlike some other grains, barley often has a more fragmented pricing structure. In many regions, farmers sell to local elevators, cooperatives, feed manufacturers, maltsters, or grain merchants rather than into a deep and globally dominant barley futures contract. That means historical barley pricing is often more regional than corn or wheat pricing.
Where barley prices are quoted and checked
Barley prices can be found in both online market data and physical market channels. The source depends on whether the reader wants a financial benchmark, a farm selling price, an import/export reference, or a historical statistical series.
| Source type | What it shows | Who uses it | Important limitation |
|---|---|---|---|
| Local elevator or cooperative bids | Nearby cash buying prices for specific delivery points and quality | Farmers, local traders, feed buyers | Only valid for that location, period, and specification |
| Government agricultural market reports | Regional or national average cash prices and market commentary | Analysts, producers, policymakers | May lag real-time trade and may average different qualities |
| Export and port indications | Values near export channels, often FOB or port-delivered references | Merchants, exporters, import buyers | Not the same as on-farm price after inland freight and basis |
| Exchange futures data | Tradable benchmark contracts where available, or related feed grain benchmarks | Traders, hedgers, analysts | May track related grains more than local barley cash values |
| Commercial data vendors and charting services | Historical charts, comparisons, basis tools, export and weather overlays | Professional traders, merchants, procurement teams | Often subscription-based and not a substitute for local cash discovery |
Farmers usually check local barley bids through grain elevators, cooperatives, merchants, and malt buyers operating in their region. Exporters and larger feed buyers monitor port values, tender results, freight, and prices of substitute grains. Analysts often combine USDA, national statistics offices, customs data, and exchange data to build a longer historical view.
Futures prices versus local cash barley prices
This difference is essential. A futures price is an exchange-traded benchmark for a standardized contract. A cash price is the negotiated or posted price for actual physical barley at a specific place and time.
Where a barley futures market is not liquid or not locally relevant, market participants often watch related feed grain futures, especially wheat or corn contracts, to understand broad feed market direction. But a local barley bid can still move differently because of basis, quality, freight, and regional supply.
| Market type | How it works | Where it is accessed | Main risk or limitation |
|---|---|---|---|
| Futures market | Standardized financial contract traded on a regulated exchange | Through a futures broker and trading platform | Margin calls, leverage, expiry, and basis mismatch with physical barley |
| Cash market | Physical sale or purchase of actual grain with quality and delivery terms | Elevators, merchants, cooperatives, feed mills, maltsters, exporters | Location-specific pricing, quality risk, freight, and counterparty exposure |
| Forward cash contract | Physical contract agreed before delivery, often with set basis or flat price | Directly with a buyer or merchant | Production shortfall risk and contract performance obligations |
For example, if a futures benchmark rises, a local barley bid may rise less, rise more, or not rise at all. That depends on local stocks, export demand, feed demand, quality spreads, and logistics congestion. This is why historical barley analysis should always compare benchmark markets with local basis history when possible.
How barley price history is used in practice
Historical barley prices are not just for charts. Farmers, traders, buyers, and analysts use them to make operating decisions.
Farm marketing
Farmers compare current local bids with seasonal price patterns. In many barley-growing regions, harvest pressure can weaken nearby bids when supplies hit the market at the same time. Historical records help identify whether carrying grain in storage has usually been rewarded after harvest, although storage costs, shrink, financing, and quality risk must also be included.
Procurement and input planning
Feed manufacturers and maltsters use price history to time coverage and assess whether current offers are attractive relative to prior years and substitute grains. They also compare barley values with corn and wheat in feed rations.
Hedging and risk management
Where barley exposure is hedged indirectly, companies may use wheat or corn futures through a regulated broker account. This is a financial hedge, not a physical grain purchase. It reduces some market exposure, but not basis risk or quality risk. Users need to track how closely their local barley cash values historically move with the chosen futures benchmark.
Trade and export analysis
Merchants compare domestic barley values with export parity or import parity. This shows whether grain is competitively priced for shipment or whether inland users can outbid exporters. Historical parity relationships are important when analyzing port bids, vessel programs, and cross-border trade.
Main drivers of barley price history
Barley prices tend to respond to a combination of crop fundamentals and market structure. Some drivers affect all grains, while others are more specific to barley.
- Weather: drought, heat, excess rain, and frost affect yield and quality.
- Quality: malting barley can trade at a premium to feed barley, but only if specification is met.
- Substitute feed grains: corn and feed wheat often cap or support feed barley demand.
- Export demand: major import tenders and buying programs can shift values quickly.
- Currency: export competitiveness changes when the local currency strengthens or weakens.
- Freight and logistics: rail disruptions, truck costs, port congestion, and vessel availability affect net farm price.
- Stocks and storage: tight old-crop stocks usually support nearby markets.
- Government policy: tariffs, quotas, trade restrictions, or phytosanitary rules can alter trade flows.
Quality is especially important in barley history because the spread between malting and feed barley can change a lot from year to year. A large crop can still produce firm malting prices if protein, germination, plumpness, or weather damage issues reduce the amount of barley that meets malt specifications.
Where to find historical barley data online
The best source depends on the question being asked.
For broad agricultural supply, demand, and price context, readers often start with USDA. USDA publications such as WASDE, Grain transport information, market outlook material, and country reports help place barley within the wider feed grain balance sheet. These are especially useful for understanding how barley competes with corn and wheat, and how trade flows may affect price history.
For futures benchmarks and contract specifications where relevant, readers use CME Group and other official exchange sources. Even when barley itself is not directly hedged there, exchange data helps with related grain benchmarks, settlement history, contract months, and market structure.
For positions held by large speculators and commercial hedgers in related grain futures, readers use CFTC Commitments of Traders. This does not show physical barley cash trade, but it can help explain broader speculative pressure in grain markets.
For international context, FAO, national agriculture ministries, national statistical agencies, and customs databases are important. These sources can show acreage trends, import and export flows, production changes, and seasonal supply patterns by country.
In the physical market, local and regional barley history often comes from:
- Elevator bid archives
- Cooperative bid sheets
- Merchant offers and pool summaries
- Maltster contract indications
- State, provincial, or national grain market reporting systems
- Port and export market circulars
These sources are often more useful for real farm decision-making than generic price websites, because they reflect actual delivery locations and commercial quality terms.
How physical barley is bought and sold
Physical barley trade is usually local or regional first, then connected to export or processing channels. The transaction flow normally includes a seller, a buyer, a delivery point, quality terms, weight determination, payment terms, and freight responsibility.
Common buyers include:
- Grain elevators and cooperatives
- Feed mills and livestock integrators
- Maltsters and brewers through approved channels
- Grain merchants and exporters
- Processors and domestic industrial users
A farmer selling barley normally checks nearby bids, asks about discounts and premiums, confirms delivery timing, and compares whether the price is quoted as picked up, delivered, or basis-linked. In some regions, direct contracts with maltsters or merchants may specify variety, protein, moisture, germination, screenings, and rejection rules. Those details matter because a barley crop can be priced as malting grain before harvest but end up sold as feed if quality standards are missed.
From the buyer side, procurement staff typically compare local offers with replacement cost from other origins, delivered feed alternatives, and export values at ports. Freight can be decisive: a strong port market does not guarantee a strong inland price if transport is expensive or capacity is tight.
Storage, seasonality, and interpreting historical patterns
Barley price history often shows seasonal behavior, but seasonality is never guaranteed. A common pattern is harvest weakness followed by firmer values later in the marketing year if supply tightens or quality becomes scarce. However, this depends on stocks, demand, freight, and competition from other feed grains.
On-farm storage and commercial storage can both change selling strategy. Storage allows delayed marketing, but it adds cost and risk.
- Interest or financing cost on unsold grain
- Storage charges if held at a commercial elevator or warehouse
- Aeration and condition management on farm
- Shrink, spoilage, pests, and quality deterioration
- Possible loss of malting quality over time
Historical prices should therefore be compared with the cost of carry. A later seasonal price increase only improves net revenue if it exceeds storage, financing, and quality risk.
Practical limits of barley price history
Historical prices are useful, but they are not a forecasting tool by themselves. They show what happened under past weather, stocks, trade policy, and freight conditions, not what must happen next.
The main limitations are:
- Different series may mix grades or locations
- Cash history may not be available in a clean long-term database
- Malting and feed barley can diverge sharply
- Related futures may be an imperfect hedge
- Export values may not translate into inland farm prices
- Currency moves can distort international comparisons
The best practice is to combine historical prices with current crop reports, weather, stocks, export pace, freight conditions, and quality assessments. For commercial users, price history is strongest when paired with basis history and actual delivered transaction data.
Where can I check barley prices today?
Check local elevator, cooperative, merchant, maltster, or feed mill bids for actual nearby cash prices. For benchmark market direction, use official exchange data where relevant and public government market reports. The local cash bid is the most relevant number for a physical seller.
Is there a global barley futures market like corn or wheat?
Barley pricing is generally less centered on one globally dominant futures benchmark than corn or wheat. In practice, many participants use local cash markets and sometimes related grain futures for risk management. Any hedge should be evaluated for basis risk and correlation with local barley values.
Why is malting barley priced differently from feed barley?
Malting barley must meet stricter quality standards such as variety acceptance, moisture, germination, protein range, and kernel characteristics. If those specifications are missed, the grain may be downgraded to feed use, often at a lower price.
Where does physical barley selling usually take place?
Most physical transactions occur through grain elevators, cooperatives, grain merchants, feed mills, maltsters, exporters, or direct farm contracts. The deal may be arranged by phone, email, merchant portal, or in-person negotiation, but settlement is based on physical delivery terms and quality standards.
Can I use futures prices as my farm selling price?
No. Futures are only a benchmark. Your actual farm price depends on basis, location, freight, quality, delivery period, and buyer competition. A strong futures market can still result in a weak local cash bid if local conditions are bearish.
What reports are most useful for understanding barley price history?
USDA supply and demand material, national agricultural statistics, customs and trade data, official exchange data, and regional cash market reporting systems are the most useful starting points. For local marketing, archived elevator or cooperative bids are often more practical than broad headline grain prices.
What units are barley prices quoted in?
That depends on the market. Common units include bushels, metric tons, or local weight measures, and prices may be quoted in local currency or U.S. dollars in trade contexts. Always confirm the unit and delivery basis before comparing one historical series with another.
Sources
- USDA Foreign Agricultural Service
- CME Group
- Food and Agriculture Organization of the United Nations