






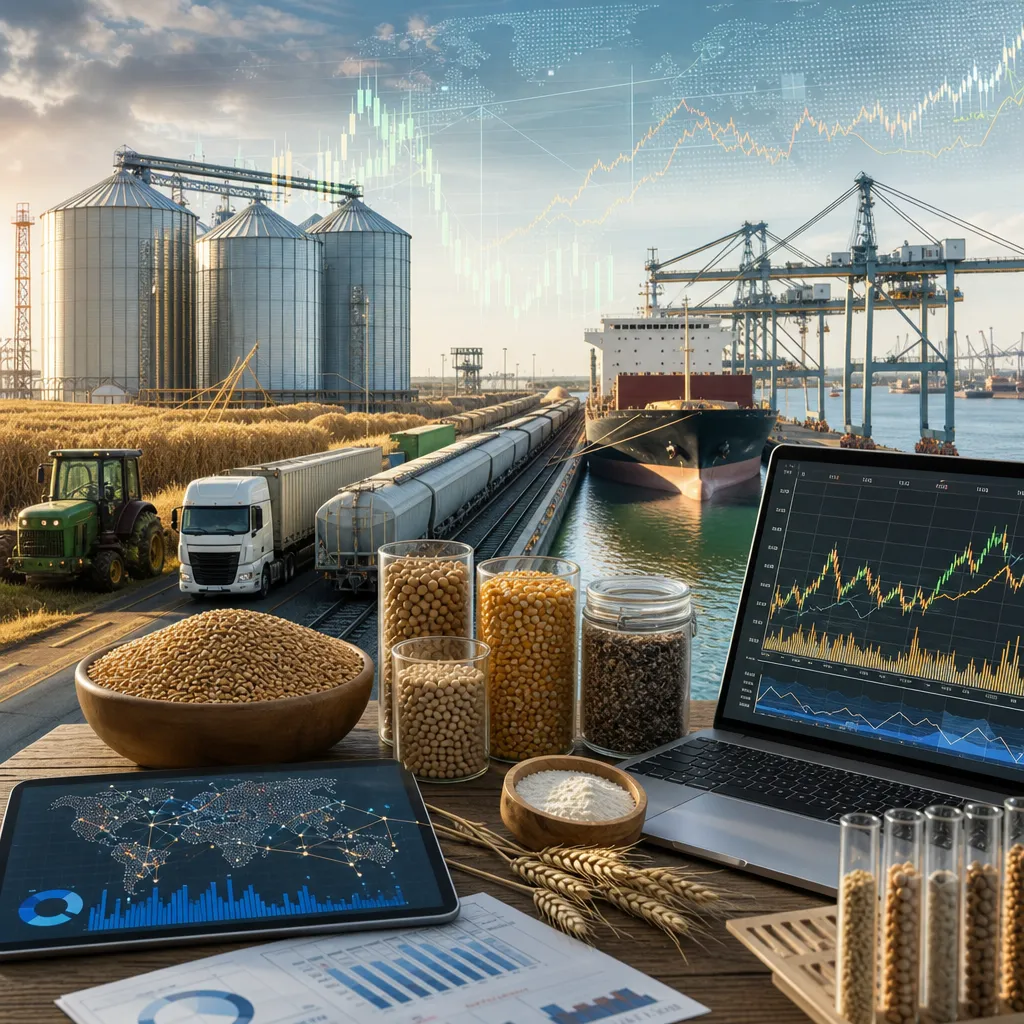
Grain price prediction models are tools that estimate how wheat, corn, soybeans, rice, barley, and other grain prices may move under different market conditions. In practice, they combine market data, crop fundamentals, weather, logistics, macroeconomic variables, and trader behavior to produce scenarios rather than certainties. The most useful models do not try to guess a single “correct” price; they show which variables matter most, how sensitive prices are to new information, and where cash and futures markets may diverge. Farmers, grain buyers, merchandisers, processors, feed mills, exporters, hedge funds, and analysts all use variations of these models, but they use them for different decisions.
To use a grain price model well, the first step is to know which price is being predicted. A Chicago futures contract is not the same as a local elevator bid, an export FOB offer, or a delivered feed mill price. A practical model must identify the market, contract month, delivery location, quality assumptions, and currency before its output can be used for hedging, storage, or physical pricing decisions.
What a grain price prediction model actually predicts
Many readers say “grain price” when they really mean one of several different prices. Prediction quality depends on matching the model to the price formation mechanism. Futures markets reflect a tradable benchmark on an exchange, while local cash markets reflect basis, freight, storage, quality, and local supply-and-demand conditions.
| Price type | Where it exists | What drives it | Who uses it |
|---|---|---|---|
| Futures price | Regulated exchange such as CME Group | Global expectations, fund flows, weather, macro risk, spreads | Hedgers, traders, brokers, analysts |
| Local cash bid | Elevators, cooperatives, merchants, processors | Futures plus or minus basis, freight, local stocks, quality | Farmers, local buyers, feed mills |
| Export price | Port market, merchant offers, tenders, FOB/CIF trade | Origin supply, freight, currency, destination demand | Exporters, importers, trade houses |
| Delivered processor price | Mill, crusher, ethanol plant, feed manufacturer | Input demand, quality specs, freight, timing | Processors, merchants, producers |
This distinction matters because a model may be excellent at forecasting exchange volatility but weak at predicting local basis. A farmer deciding whether to store corn often needs a basis-and-carry model, not only a futures-direction model. A flour mill hedging wheat input costs may need both a futures price model and a procurement model for regional protein premiums and freight.
Main types of grain price prediction models
In practice, grain price models fall into a few broad categories. Most commercial forecasting systems combine several of them.
Fundamental supply-and-demand models
These models estimate prices from acreage, yield, production, beginning stocks, ending stocks, stocks-to-use, domestic consumption, exports, and imports. They are widely used by analysts, merchant desks, and larger farms. Their logic is straightforward: tighter balance sheets usually support prices, while burdensome stocks usually pressure them.
Reliable inputs often come from public sources such as USDA reports, national agriculture ministries, statistical agencies, customs data, and FAO datasets. For U.S. grains and oilseeds, USDA publications such as WASDE, Crop Production, Grain Stocks, Crop Progress, and Export Sales are central. Outside the U.S., regional ministries, customs authorities, and exchange or port-market reports may be equally important.
Weather and crop-condition models
These models connect rainfall, temperature, soil moisture, planting pace, vegetation indices, and crop ratings to likely yields and then to price impact. They matter most during planting, pollination, grain fill, and harvest. Weather models are especially useful for corn and soybeans during sensitive growth stages and for wheat where winterkill, drought, or excessive rain can alter both yield and quality.
Users normally combine public weather data, satellite products, and crop-condition reports with local agronomic knowledge. The model output is usually probabilistic: favorable, neutral, or adverse production scenarios.
Time-series and statistical models
These models use historical price behavior, seasonality, spreads, volatility, and autocorrelation. Examples include regression models, ARIMA-type approaches, and volatility models. They are often used for short-term forecasting or risk estimation rather than deep fundamental interpretation.
They can be useful when supported by liquid historical data from exchange markets. They are less reliable when market structure changes suddenly because of policy shifts, export bans, war, or an abnormal crop event.
Basis and local-cash models
These models are highly practical for farms, elevators, and merchandisers. They focus on the local price difference between cash grain and the nearby or relevant futures contract. Inputs include freight, storage availability, river levels, port congestion, ethanol or crush margins, rail performance, local harvest pressure, and quality premiums or discounts.
This is often where the most money is made or lost in physical grain marketing. A producer may call the futures market correctly but still receive a weak local price because basis deteriorates at harvest.
Machine learning models
Machine learning can process large numbers of variables and detect patterns that are difficult to model manually. It may combine futures, options-implied signals, weather, satellite data, macro data, and text from reports or news. However, machine learning does not remove market risk. It still depends on clean data, stable relationships, and careful out-of-sample testing.
For many grain businesses, the practical benefit of machine learning is not “perfect prediction” but faster scenario analysis and better signal ranking.
How these models work in the real market
A working grain price model usually has three layers: benchmark price, local adjustment, and decision output. The benchmark is often a futures contract from a regulated exchange. For U.S. wheat, corn, and soybeans, CME Group futures are widely used references. Other regions may rely on local exchange contracts or imported benchmarks converted through currency and freight assumptions.
The second layer adjusts the benchmark into a tradable physical number. That is where basis, elevation charges, drying, protein or oil premiums, moisture discounts, transport cost, storage, and delivery timing enter. This step often requires local cash bid data from grain elevators, cooperatives, processors, exporters, or merchants. Many farms monitor elevator bid sheets, cooperative pricing tools, merchandiser offers, and official market reports to track these adjustments.
The third layer converts the price outlook into an action. That action could be selling cash grain, setting basis, hedging futures, buying a put option, holding inventory in on-farm storage, or waiting for a report release. A model is only useful if it supports a real decision under actual contract terms.
Where the data comes from and where to check it
Good grain forecasting depends more on data quality than on model complexity. The best-known public data sources are often enough to build a useful framework.
| Data source | What it provides | How it is used in models |
|---|---|---|
| USDA | WASDE, Crop Progress, Grain Stocks, Export Sales, production estimates | Balance sheets, yield scenarios, export pace, seasonal revisions |
| CME Group | Futures and options contract information and market data | Benchmark pricing, spreads, volatility, hedging assumptions |
| CFTC | Commitments of Traders positioning data | Sentiment, fund exposure, positioning extremes |
| FAO and national statistical agencies | Global agriculture data, trade, production, food balance information | Cross-country comparison, structural demand and supply trends |
| Local bids and physical market reports | Elevator bids, processor bids, port basis, regional cash prices | Basis forecasting, logistics and regional demand modeling |
For online use, analysts typically pull exchange and report data into spreadsheets, statistical software, charting packages, or dedicated ag-market platforms. Larger firms may use APIs from market-data vendors or internal data warehouses. Farms and smaller grain businesses often rely on a simpler stack: elevator bids, exchange delayed quotes, government reports, and a spreadsheet model.
Physical market information does not always appear in clean public datasets. River freight, export lineups, quality spreads, and local supply stress may instead come from merchants, brokers, cooperatives, warehouses, processors, and port contacts. That is why a strong local market network often improves forecast usefulness more than a more advanced algorithm does.
Using prediction models for trading, hedging, and merchandising
There are two different environments in which grain price models are used: the financial market and the physical market.
In the financial market, grain futures and options are traded on regulated exchanges through a futures broker. The user needs a brokerage account, understands margin requirements, and trades standardized contracts with specific delivery months and contract rules. This is suitable for hedging or speculation, but it does not by itself move physical grain.
In the physical market, grain is bought and sold through elevators, cooperatives, merchants, feed companies, mills, crushers, exporters, and direct contracts. The transaction depends on grade, moisture, test weight, protein or oil content where relevant, location, timing, freight responsibility, and payment terms. A physical price model must reflect these details.
Common practical uses include:
- Farm hedging: forecasting futures direction and basis separately, then deciding whether to forward contract, hedge with futures, or buy options.
- Elevator merchandising: predicting basis behavior, storage returns, and spread relationships between nearby and deferred futures.
- Processor procurement: estimating delivered grain costs under different harvest, logistics, and currency scenarios.
- Exporter pricing: combining interior origin costs, transport, elevation, port basis, and international demand signals.
- Speculative trading: using model outputs to trade futures or options, with strict attention to leverage and risk limits.
A useful rule is that a model for hedging should focus on protecting margins, not on maximizing forecast accuracy in isolation. A feed manufacturer may not need to predict the exact high or low; it may only need to identify when input-cost risk is unusually high and secure coverage.
Key variables that move grain prices
Different grains respond to different drivers, but several variables appear in almost every serious model.
- Acreage and planting pace: early estimates shape production expectations before yield is known.
- Yield risk: often the largest source of supply uncertainty.
- Stocks and stocks-to-use: general measure of market tightness or comfort.
- Export competitiveness: strongly affected by currency, freight, and relative origin prices.
- Feed, food, and industrial demand: includes livestock feeding, milling, crushing, and biofuels.
- Energy and fertilizer: influence production cost and biofuel-linked pricing relationships.
- Government policy: tariffs, export restrictions, subsidies, blending mandates, and phytosanitary rules.
- Logistics: rail, barge, truck, port capacity, river depth, and congestion can alter basis sharply.
- Quality: protein, moisture, falling number, mycotoxins, oil content, and damage can create large local spreads.
Models that ignore quality and logistics often perform poorly in real merchandising. For example, a general wheat price model may miss the premium for higher-protein milling wheat in a tight-quality year.
Limits, risks, and common mistakes
No grain price model is consistently correct across all market regimes. Weather shocks, policy interventions, wars, macroeconomic crises, and abrupt shifts in fund positioning can overpower historical relationships. Even a statistically sound model can fail if the underlying market structure changes.
Common mistakes include:
- Confusing futures with cash: a strong board does not guarantee a strong local bid.
- Ignoring basis risk: especially dangerous when storage, freight, or regional demand shifts rapidly.
- Using poor-quality data: late, inconsistent, or non-comparable series can distort outputs.
- Overfitting: a model that explains the past perfectly may trade badly in real time.
- Using one model for every grain and region: corn, rice, canola, and barley do not price the same way.
- Assuming forecasts equal recommendations: a price scenario must still be tested against cash-flow needs, storage limits, and credit lines.
Costs also matter. Forecasting tools may require market-data subscriptions, software licenses, broker access, storage records, freight updates, and staff time. For some users, a disciplined spreadsheet based on USDA data, exchange benchmarks, and local basis history is more cost-effective than a complex commercial platform.
How to build a practical grain price prediction workflow
A practical workflow does not need to be complicated. It needs to be repeatable and tied to decisions.
- Define the target price: nearby futures, new-crop cash bid, delivered plant price, or export parity.
- Collect benchmark data: exchange prices, contract specs, seasonal patterns, volatility.
- Add fundamentals: acreage, yield, stocks, exports, imports, demand indicators.
- Add local factors: basis history, freight, storage, quality spreads, delivery windows.
- Update on report dates: especially major crop and stocks reports.
- Create scenarios: favorable weather, adverse weather, demand surprise, policy shock.
- Link to actions: cash sale, hedge, option structure, storage decision, or no action.
- Review performance: measure not only forecast error, but also decision quality.
Where this is done depends on the user. A producer may work mainly through elevator bids, cooperative marketing tools, and government reports. A commercial trader may use broker platforms, proprietary data terminals, API feeds, and risk systems. A processor may combine procurement records with exchange hedges and freight monitoring.
Where can I check grain prices online?
Exchange benchmark prices are commonly checked through exchange websites such as CME Group, broker platforms, market-data services, and agricultural news terminals. Local cash bids are usually checked through grain elevator, cooperative, processor, or merchant bid sheets and regional market reporting services. These are different prices and should not be treated as interchangeable.
What is the difference between a grain futures prediction model and a cash grain model?
A futures model predicts a standardized exchange-traded benchmark. A cash model predicts the real price paid or received at a location after basis, quality adjustments, freight, and timing are applied. Physical grain sellers and buyers usually need both.
Where are grain futures traded?
Major grain futures are traded on regulated commodity exchanges, with CME Group being especially important for U.S. grain benchmarks. Access is normally through a licensed futures broker or brokerage platform. Trading futures does not mean taking delivery of physical grain unless a participant keeps a position into delivery under contract rules.
Can a farmer use prediction models without trading futures?
Yes. A farmer can use models to time cash sales, compare spot bids with forward contracts, evaluate storage, or decide whether basis should be set now or later. Futures are one tool, but physical marketing decisions can also be informed by forecast models.
Which reports matter most for grain price forecasting?
For many markets, USDA reports such as WASDE, Crop Progress, Grain Stocks, Crop Production, and Export Sales are core inputs. CFTC positioning data can help interpret market sentiment, while national statistics offices and customs data help with regional trade analysis. The right report depends on the crop and region being modeled.
Why do local grain bids sometimes fall when futures rise?
This usually reflects weaker basis. Elevators or processors may lower bids because of freight problems, harvest pressure, full storage, lower quality, or reduced local demand even while the exchange benchmark rises. This is why local basis modeling is essential in physical grain marketing.
Are machine learning models better than traditional grain models?
Not automatically. Machine learning can capture complex patterns, but it can also overfit and become hard to interpret. In grain markets, a transparent model with strong data and good local basis inputs is often more useful than a black-box system.
Sources
- USDA Foreign Agricultural Service and USDA World Agricultural Supply and Demand Estimates
- CME Group
- U.S. Commodity Futures Trading Commission