Interpreting USDA grain reports is an essential skill for anyone involved in the agricultural commodity business. These publications offer detailed insights into global grain balances, guiding traders, producers, and analysts in their decision-making processes. By understanding the structure and methodology behind USDA releases, stakeholders can anticipate price movements, identify market trends, and optimize risk management strategies.
Understanding USDA Grain Reports
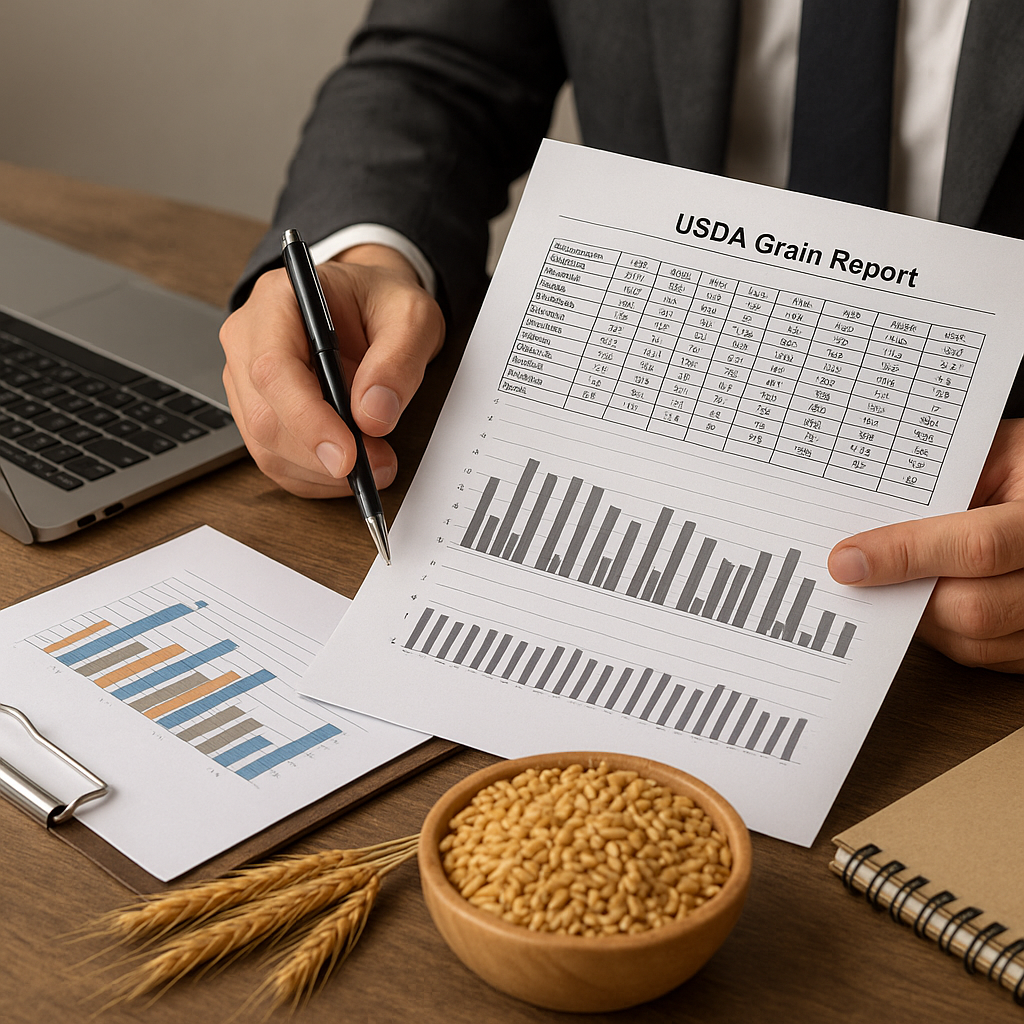
The United States Department of Agriculture (USDA) publishes several key documents each month, including the World Agricultural Supply and Demand Estimates (WASDE) and Grain Stocks reports. These reports are the cornerstones of transparent market information, covering major crops such as corn, wheat, soybeans, and rice. By providing forecasts for production, supply, demand, and ending stocks, policymakers and market participants gain a comprehensive view of evolving conditions both domestically and internationally.
WASDE is the USDA’s flagship publication, typically released on the second Friday of every month. It consolidates data from farm surveys, satellite imagery, and international correspondence, offering a global perspective. Grain Stocks, on the other hand, focuses on quarterly surveys of on-farm and commercial stocks within the United States, highlighting current inventory levels and refining the supply outlook.
Key USDA Publications
- WASDE—World Agricultural Supply and Demand Estimates report with global projections
- Grain Stocks—Quarterly snapshot of on-farm and off-farm inventories
- Agricultural Prices—Monthly average prices received by farmers
- Export Sales—Weekly reports on U.S. grain commitments to overseas buyers
Key Components: Supply and Demand Data
At the core of every report lies a meticulous breakdown of supply and demand balances. Interpreting these figures allows market players to estimate how much product will flow through commercial channels and how much will remain as carryover into the next marketing year.
Supply Side Metrics
- Beginning Stocks: Carryover from the previous year, serving as the initial inventory pool.
- Production: Harvest yield multiplied by harvested acreage; influenced by weather events, agronomic practices, and technological advances.
- Imports: Volumes entering the domestic market from global suppliers, critical for crops where the U.S. is a net importer.
Demand Side Metrics
- Feed and Residual Use: Grain consumed by livestock and unaccounted losses during handling.
- Food, Seed, and Industrial Use: Domestic processing for food products, biofuels, and other industrial applications.
- Exports: Quantities sold abroad, reflecting the competitiveness of U.S. crops on the international stage.
- Ending Stocks: Stocks remaining at the close of the marketing year; a key indicator of supply tightness or abundance.
By comparing changes in these categories from one report to the next, analysts can gauge shifts in market fundamentals. A significant revision in production often prompts immediate price reactions, while adjustments to ending stocks influence longer-term expectations.
Analyzing Market Impact
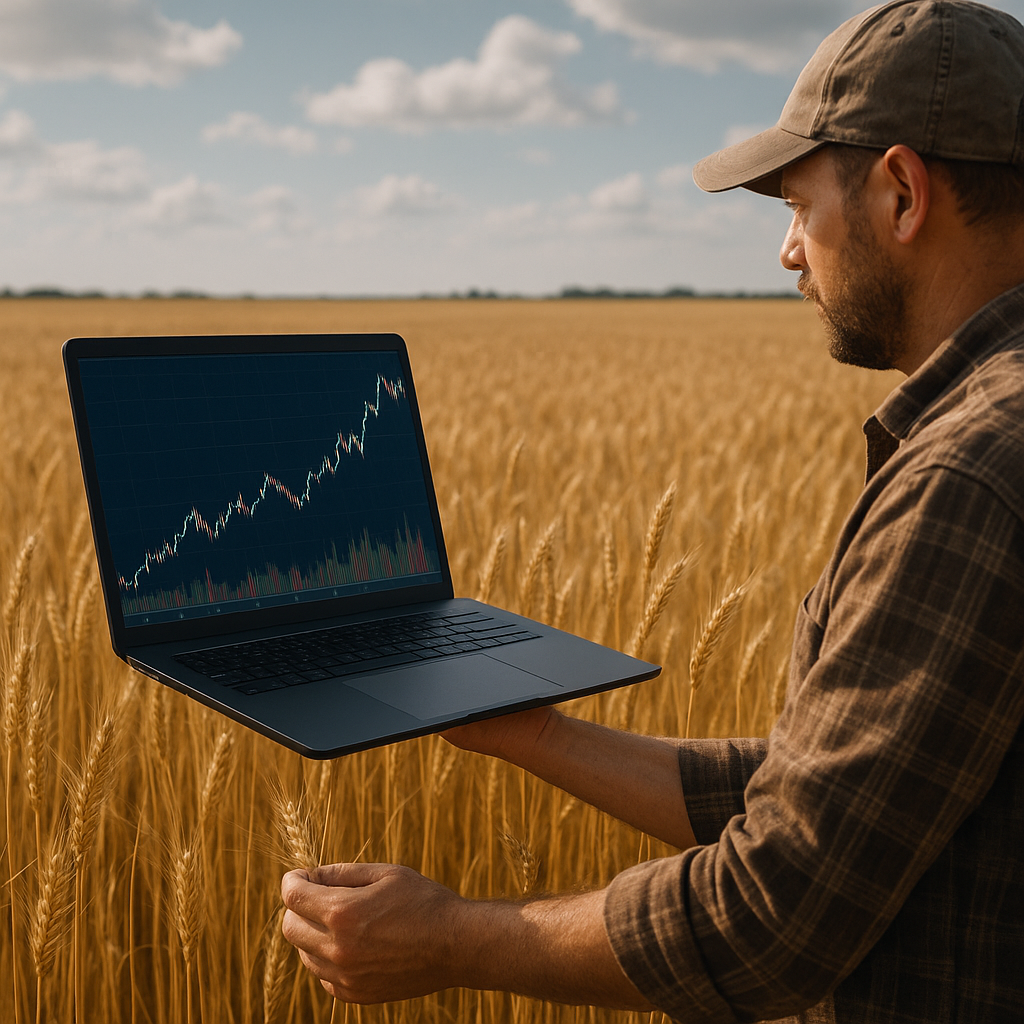
Once the USDA releases its figures, markets can react swiftly. Commodity exchanges such as the Chicago Board of Trade (CBOT) price futures contracts before and after the data drop, often experiencing sharp volatility. Successful traders anticipate possible revisions by monitoring pre-release surveys, weather patterns, and planting progress reports.
Price Discovery and Futures
Futures prices embed collective expectations of future scarcity or surplus. If the USDA lowers its estimate for ending stocks, less inventory implies a tighter balance sheet, usually triggering a rally in futures contracts. Conversely, upward revisions of production can exert downward pressure on prices as the market digests added supply.
Interpreting Revisions
It’s not only the absolute numbers that matter but also the magnitude and direction of their revisions. A slight adjustment in projected exports might be counterbalanced by changes in domestic consumption, dampening overall price impact. Large surprises, however, can lead to multi-session trends where bulls or bears dominate.
- Positive Revision in Production → Potential Bearish Sentiment
- Negative Revision in Ending Stocks → Potential Bullish Sentiment
- Unexpected Export Surges → Strengthening of Domestic Prices
- Higher Feed Use Forecasts → Indication of Robust Animal Protein Demand
Strategies for Traders and Producers
Effective market participants integrate USDA data with technical analysis, macroeconomic factors, and risk management tools. Both farmers and commercial traders can leverage reports to optimize their marketing and hedging plans.
Hedging with Futures and Options
Producers often lock in prices through futures contracts, mitigating downside risk when sowing crops. Options strategies, such as purchasing puts or selling calls, provide more flexibility, allowing participation in upside moves while protecting against adverse price declines.
Fundamental vs. Technical Analysis
- Fundamental Analysis: Evaluating USDA data alongside global supply trends, currency movements, and policy developments.
- Technical Analysis: Identifying chart patterns, support and resistance levels, and momentum indicators to time entries and exits.
- Combining both approaches often yields a more robust trading signal than relying on one method exclusively.
For example, a trader might notice that USDA’s upward revision in corn production coincides with a downward trendline breach on the daily futures chart. This alignment of fundamental bearishness and technical confirmation increases the probability of a successful short position.
Adapting to Seasonal Cycles
Grain markets are inherently seasonal. Planting, growing, and harvest periods bring recurring patterns of volatility. Understanding how USDA reports interact with these cycles allows for strategic timing of sales and purchases. Early-season credit lines, crop insurance considerations, and basis levels at local elevators all factor into comprehensive marketing plans.
By mastering the interpretation of USDA grain reports, stakeholders can transform raw data into actionable intelligence, navigating the complexities of global agricultural markets with confidence.