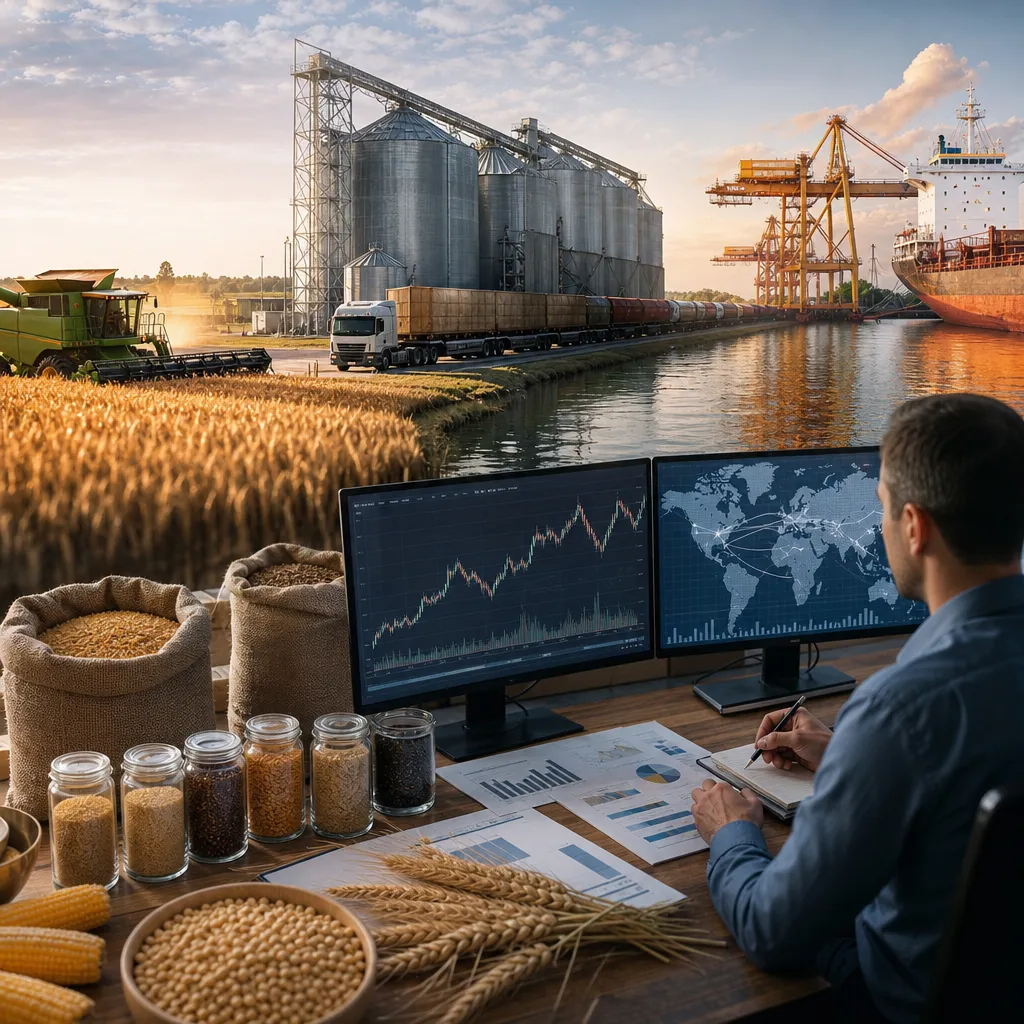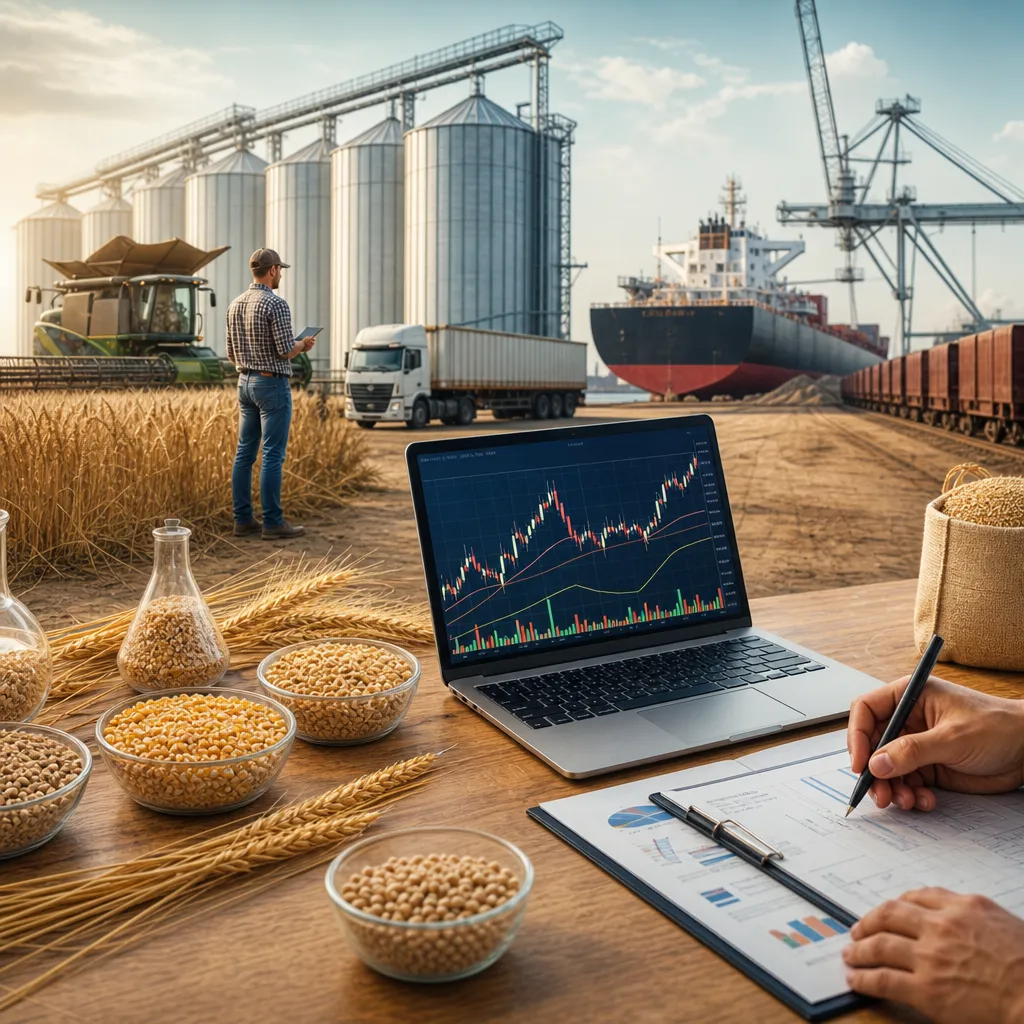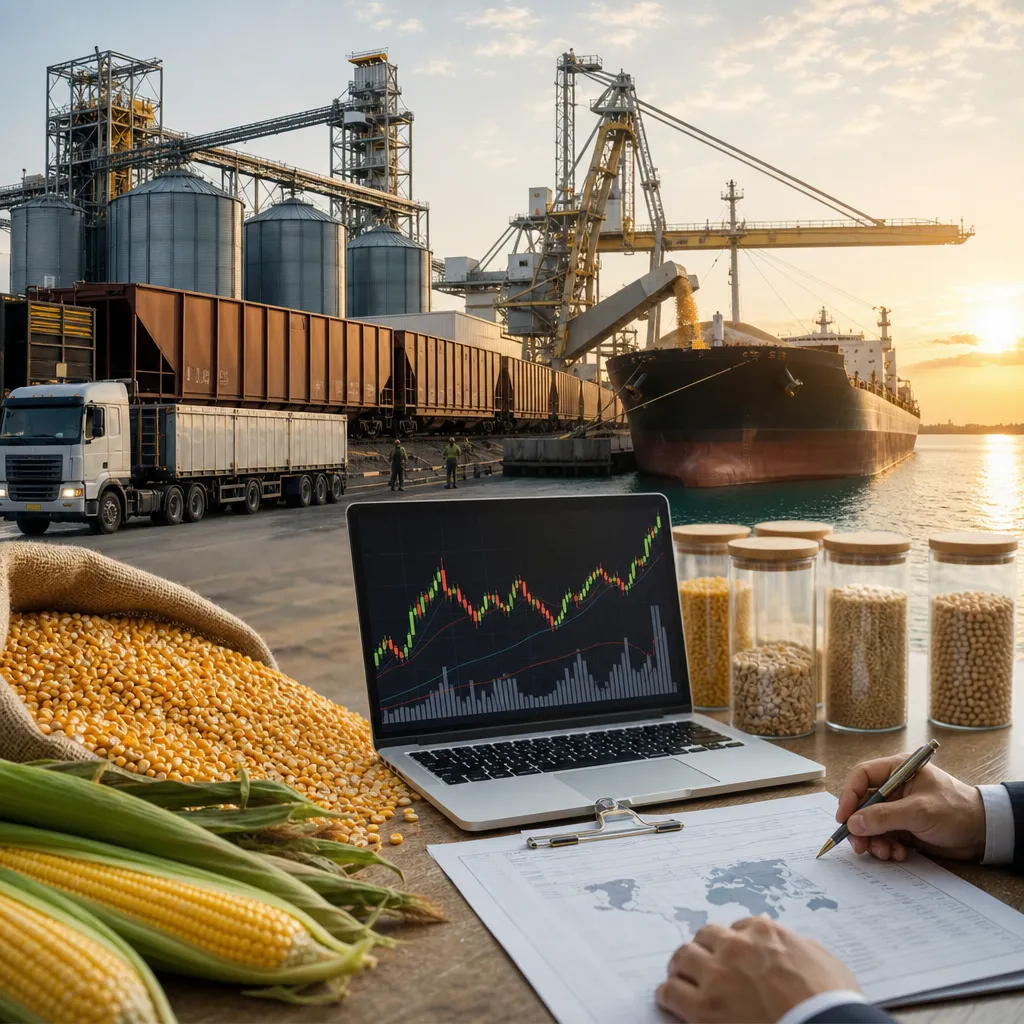









The United States is one of the world’s most important corn markets, so “US corn supply and demand” refers not just to farm production, but to the full balance between acreage, yields, stocks, feed use, ethanol demand, exports, and prices across the country. Corn is grown widely across the Midwest and Plains, priced through both futures and cash markets, and consumed domestically by livestock feeders, ethanol plants, food processors, and industrial users. Because the US is also a major exporter, internal supply and demand conditions are closely tied to global trade, freight, and competing origins such as Brazil, Argentina, and Ukraine. For farmers, merchandisers, importers, and investors, understanding this market means knowing where the crop is produced, how prices are discovered, and how physical grain and futures are connected.
What “US corn supply and demand” means
In practical grain-market terms, supply and demand is the balance sheet for corn in the United States. Supply usually includes beginning stocks, the new crop harvested in the current marketing year, and in some cases imports. Demand includes feed and residual use, ethanol and other industrial processing, food use, exports, and ending stocks.
This balance matters because corn prices are driven less by production alone than by the relationship between available supply and total usage. A large crop can still support firm prices if exports are strong or ethanol plants are bidding aggressively. A smaller crop can still pressure prices if demand weakens or stocks remain comfortable.
The United States Department of Agriculture, especially through the World Agricultural Outlook Board and the National Agricultural Statistics Service, is the main institutional reference point for this market. USDA reports shape expectations for planted area, harvested area, yield, production, stocks, and export demand.
Where the US corn market operates
The US corn market is national, but its physical center of gravity is the Corn Belt. States such as Iowa, Illinois, Nebraska, Minnesota, Indiana, and surrounding areas are central to production, storage, and merchandising. Corn also has important demand centers beyond those farm states, including livestock regions, river terminals, ethanol plants, feed mills, processors, and export elevators.
Physically, corn moves by truck, rail, and barge from farms to country elevators, processors, feed users, and terminal markets. Export channels are especially important. Grain can move down the inland river system toward the Gulf export market, by rail to domestic users or Pacific Northwest export channels, or to regional processors located close to production areas.
Financially, the benchmark market is the Chicago Board of Trade corn futures contract, now part of CME Group. That futures market is the main reference used to value US corn, but most farmers and grain users do not trade only futures. They buy and sell physical corn in local cash markets, where prices differ from futures because of basis, freight, quality, timing, and local supply-demand conditions.
How US corn prices are formed
US corn pricing starts with benchmark futures, but the final physical price depends on location and market channel. The CBOT corn futures contract is quoted in US cents per bushel and serves as the main pricing reference for old-crop and new-crop expectations. However, a futures quote is not the same thing as a farm-gate bid.
A local elevator cash bid is usually expressed as futures plus or minus a basis. Basis reflects local conditions such as transport cost, storage availability, buyer competition, processor demand, and export economics. In a surplus production region at harvest, basis may weaken because supplies are heavy and storage is tight. In a deficit area or where processors need grain immediately, basis may strengthen.
Export prices are often discussed differently from inland farm bids. At the export level, prices may be quoted on an FOB basis, meaning free on board at the export point, or in other trade terms depending on the contract. An importer may compare US Gulf or Pacific Northwest offers against other world origins. Those export values then work back through the supply chain and influence bids at interior terminals and country elevators.
| Price type | Where it is used | What it means |
|---|---|---|
| CBOT futures price | Exchange benchmark | Reference price for hedging and price discovery, quoted in US cents per bushel |
| Local cash bid | Farm elevator, cooperative, processor | Actual nearby purchase offer for physical corn at a given location and delivery period |
| Basis | Cash market relationship to futures | Difference between local cash price and the relevant futures contract |
| Delivered price | Feed mill, ethanol plant, processor | Price including delivery to the buyer’s facility under stated quality terms |
| FOB export price | Export terminal trade | Price of corn loaded for export at the named origin, before ocean freight |
Main supply drivers in the United States
The supply side of the US corn market depends first on planted acres and harvested acres. Planting decisions respond to relative economics versus soybeans and other crops, expected input costs, crop insurance considerations, and regional agronomic conditions. Acreage is then followed by weather risk through the growing season.
Yield is often the most market-sensitive variable. Corn is particularly responsive to planting windows, summer heat, pollination conditions, and late-season moisture. Because the United States produces such a large corn crop, even moderate changes in national yield expectations can reshape the entire supply outlook.
Beginning stocks also matter. Large carry-in stocks can cushion the market against production problems. Tight beginning stocks can make weather scares more severe because there is less inventory to absorb losses.
Imports are normally not the defining element of US corn supply, but they can matter in certain border or regional situations. Overall, the market is still driven overwhelmingly by domestic production and stock levels.
Main demand drivers: feed, ethanol, and exports
On the demand side, corn has several major channels. Feed demand is linked to the size of the livestock and poultry sectors and to feed substitution among corn, wheat, sorghum, and other ingredients. If feed wheat becomes competitive, corn demand can shift. If livestock margins improve, feed usage can strengthen.
Ethanol is another core driver. In the United States, corn is a major feedstock for ethanol production, so plant margins, energy markets, gasoline blending demand, and biofuel policy all influence domestic corn consumption. When ethanol plants are profitable and running hard, local basis near those plants often strengthens.
Exports are the main external demand variable. US corn export performance depends on price competitiveness, harvest timing versus South America, logistics conditions, currency relationships, and buyer demand from importers around the world. The United States may be highly competitive in one period and less so in another, depending on Brazil’s second-crop corn availability, Black Sea trade conditions, and ocean freight economics.
Food, seed, and industrial uses also matter, though they usually receive less market attention than feed, ethanol, and exports.
How grain is actually bought, sold, exported, and hedged
Physical corn in the United States is normally traded through country elevators, cooperatives, grain merchants, ethanol plants, feed mills, processors, and exporters. Farmers may sell spot at harvest, forward contract for later delivery, use hedge-to-arrive contracts, store grain and sell later, or negotiate basis separately from futures timing. Each contract should clearly define delivery period, quality standards, moisture and damage allowances, payment method, and title transfer.
Export trade is handled by merchants and exporters operating terminal and port logistics. They assemble grain from the interior, manage freight and elevation, and sell abroad under commercial terms agreed with foreign buyers. Inland bids are influenced by whether exporters can compete with domestic processors and by whether export margins justify pulling grain toward terminal markets.
Futures and options are different from physical grain ownership. A farmer, cooperative, merchant, processor, or investor can access CBOT corn futures and options through a regulated brokerage account. Futures are used to hedge flat-price risk, while options can be used to manage price exposure with different risk profiles. A hedge does not remove basis risk, because the futures position and the local cash market may not move in perfect lockstep.
Speculators also participate in the futures market, but that does not mean they are moving physical corn. Futures trading creates financial exposure to corn price movements; physical trade requires actual grain, logistics, storage, inspection, and contract performance.
| Market channel | Who typically uses it | Practical purpose |
|---|---|---|
| Country cash market | Farmers, elevators, cooperatives | Immediate or forward physical sale and delivery |
| Processor bid market | Ethanol plants, feed mills, wet mills | Procurement of corn for domestic use, often with location-specific basis |
| Export terminal market | Merchants, exporters, importers | Assembly and sale of corn into world trade |
| CBOT futures and options | Hedgers and financial traders | Manage or assume price risk without necessarily handling physical grain |
Where to check US corn prices and market information online
Readers looking for current US corn pricing should separate benchmark futures from local cash bids. For futures, CME Group is the primary source for CBOT corn contract information. Market data vendors and brokerage platforms also publish delayed or real-time futures prices depending on access arrangements.
For official supply-and-demand information, USDA is essential. The World Agricultural Supply and Demand Estimates report is the standard reference for the national balance sheet. NASS provides acreage, crop progress, condition, stocks, and production reports. The Foreign Agricultural Service and the weekly Export Sales reporting system are widely followed for trade demand.
For local cash prices, the best sources are often country elevators, cooperatives, ethanol plants, regional grain merchants, and processor bid sheets. These are the places that publish actual buying bids for specific delivery windows and locations. A farmer in Iowa and a feed buyer in the Southeast may both watch the same CBOT futures contract online, but their physical prices can differ substantially because basis differs.
The Agricultural Marketing Service within USDA also provides market reporting for many physical grain locations and transportation indicators. That information can help users understand how interior bids, barge values, and export channels are interacting, even when it is not a substitute for a direct executable local bid.
Key factors to watch in a forecast
Any forecast for US corn supply and demand should be treated as a scenario, not a certainty. The most important variables usually include spring planting pace, summer weather, pollination conditions, disease pressure, and harvest results. Acreage can still change through producer decisions and weather disruptions, while yield expectations can shift quickly during the growing season.
On the demand side, analysts typically watch livestock economics, ethanol margins, energy prices, export competitiveness, and currency trends. Freight and river logistics can matter as well, especially when they affect the movement of corn from inland origins to export positions.
Another major variable is competition from other exporters. If Brazil has a large crop and aggressive export pricing, US export demand can slow. If global buyers need nearby coverage during a period when the United States is best positioned logistically, US export demand can improve. Domestic ending stocks are often the summary number the market watches most closely because they indicate how tight or comfortable the balance sheet may become.
| Factor | Why it matters | Likely market effect if it changes |
|---|---|---|
| Planted and harvested area | Sets the production base | Larger area can increase supply potential; smaller area can tighten outlook |
| Yield expectations | Biggest driver of total crop size | Higher yields can pressure prices; lower yields can support them |
| Ethanol demand | Large domestic consumption channel | Strong processing demand can improve basis and tighten stocks |
| Export competitiveness | Determines share in world trade | Improved competitiveness can raise export demand and support prices |
| Ending stocks | Measures cushion in the balance sheet | Tighter stocks generally increase sensitivity to weather and demand surprises |
Practical reading of the market
For a practical market view, start with three levels at once: national balance sheet, futures trend, and local basis. The national figures explain whether the US market is becoming tighter or looser. Futures show how the broader market is pricing risk. Local basis tells you what your nearby buyer actually needs.
That combination is especially important because the same national corn market can produce very different local outcomes. A large US crop does not prevent a strong basis at a processor that needs immediate bushels. Likewise, a bullish futures market does not guarantee a strong farm cash price if local transportation is congested or harvest pressure is intense.
For international users, it is also important to remember that US corn is priced in US dollars and commonly referenced in bushels domestically, while world trade participants often compare export values in dollars per metric ton. Comparing inland US cash bids directly with imported landed prices in another country can be misleading unless logistics and trade terms are aligned.
FAQ
What is the main benchmark for US corn prices?
The main benchmark is CBOT corn futures traded through CME Group. It is the reference point for much of US price discovery, but it is not the same as a local physical cash bid.
Where can I check current US corn prices?
For benchmark futures, check CME Group or a brokerage or market-data platform. For actual physical prices, check local elevators, cooperatives, ethanol plants, processors, and USDA market reporting where available.
Why is my local cash corn price different from futures?
Because cash price equals futures plus or minus basis. Basis reflects local supply and demand, freight, storage, quality, buyer competition, and delivery timing.
How is corn physically sold in the United States?
Most physical corn is sold to elevators, cooperatives, processors, feed users, or merchants under spot or forward contracts. The contract should specify delivery period, quality, and payment terms.
Is the United States mainly a corn exporter or a domestic consumer?
It is both. The US is a major exporter, but a very large share of corn is also consumed domestically for feed, ethanol, and industrial uses.
How do exporters influence inland corn prices?
When export demand is strong, terminal and river bids can strengthen, which can pull grain from inland areas and support basis. When export demand is weak, domestic users may have less competition for corn.
Can I hedge corn without buying or selling physical grain?
Yes. Futures and options allow price exposure through a brokerage account without taking physical ownership. But these instruments involve margin, leverage, and basis risk if used against a physical position.
What reports are most important for US corn supply and demand?
USDA’s WASDE, NASS acreage and production reports, Crop Progress reports, Grain Stocks reports, and FAS export data are among the most important official references.
Sources
- US Department of Agriculture (USDA)
- CME Group
- USDA Agricultural Marketing Service