Grain market reports provide a window into the complex world of agricultural commodities, offering traders, analysts, and producers the data they need to make informed decisions. By examining supply, demand, pricing, and external factors, these reports can reveal emerging opportunities and risks. Mastering the interpretation of grain market reports requires familiarity with key terminology, an eye for seasonal trends, and an understanding of how global events shape local markets. This guide explores several facets of grain market analysis, from decoding statistical tables to applying insights in trading strategies.
Understanding the Structure of Grain Market Reports
Most grain market publications follow a similar outline, beginning with a high-level overview and drilling down into detailed data. Reports issued by government agencies, commodity exchanges, and private consultancies vary in style, but share core elements. Recognizing these sections helps you locate the supply and demand metrics, price forecasts, and commentary on external drivers quickly.
Report Sources and Credibility
Before delving into numbers, evaluate the report’s origin. Official bodies like the USDA or national statistical offices typically offer fundamentals based on comprehensive surveys. Exchange bulletins present real‐time trading data, while private firms often include proprietary forecasts and scenario analysis. Cross‐referencing multiple sources can enhance the reliability of your conclusions.
Key Sections to Watch
- Executive Summary: High‐level takeaways on production, ending stocks, and price outlook.
- Balance Sheets: Quantitative tables showing beginning stocks, production volumes, imports, exports, feed use, and closing stocks.
- Price Charts: Historic and projected price indexes, often expressed in local currency or USD per bushel/ton.
- Weather and Crop Conditions: Regional updates on precipitation, temperature anomalies, and soil moisture.
- Global Trade Flows: Data on shipments between key producing and consuming countries.
Deciphering Supply, Demand, and Stock Indicators
At the heart of any grain report lies the balance between supply and demand. Understanding these variables helps you anticipate price swings, gauge market tightness, and assess potential volatility. The most critical figure is the Stocks‐to‐Use ratio, which measures ending stocks relative to total consumption. A low ratio suggests a tight market and bullish price pressure, while a high ratio indicates ample availability and potential price weakness.
Production Estimates and Revisions
Crop production numbers hinge on acreage planted, yield projections, and weather developments. Analysts revisit these estimates monthly or quarterly, adjusting for droughts, flooding, or pest outbreaks. A downward revision can trigger price spikes, especially if global inventories are already low. Continuous monitoring of these updates is essential for accurate risk assessment.
Consumption Patterns and Shifting Demand
Consumption covers human food use, animal feed, industrial processing, and seed requirements. Demographic shifts, changing dietary trends, and biofuel mandates can all reshape demand. For example, an increase in ethanol blending mandates boosts corn demand, while a global pivot to plant‐based proteins may alter soybean usage. Tracking policy changes and consumer behavior trends offers a window into evolving demand dynamics.
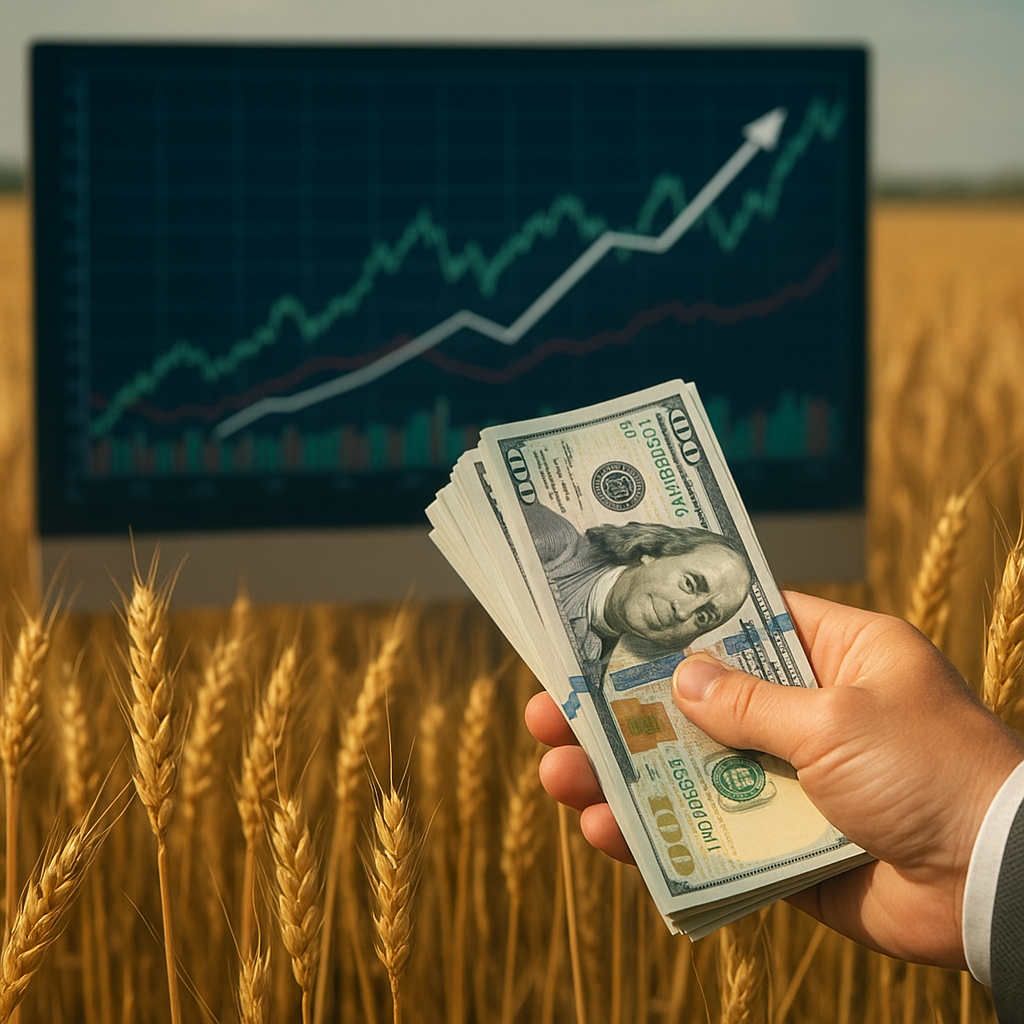
Assessing Price Trends and Market Sentiment
Grain prices react not only to raw supply and demand metrics but also to market sentiment and speculative flows in futures markets. Price charts and technical indicators complement fundamental analysis, helping you spot momentum shifts or emerging trend analysis signals. Combining these tools allows a more nuanced view of potential entry and exit points.
Technical Indicators Commonly Used
- Moving Averages (50‐ and 200‐day) to identify long‐term trends
- Relative Strength Index (RSI) for overbought or oversold conditions
- Bollinger Bands to gauge volatility expansion or contraction
- Candlestick Patterns for short‐term reversal signals
Interpreting Futures Open Interest and Volume
Open interest measures the number of outstanding contracts, offering clues about speculative engagement. Rising volume and open interest alongside price gains typically confirm a bullish move, whereas falling interest can presage trend exhaustion. These metrics inform decisions about entry, position sizing, and risk management strategies.
Incorporating Seasonal and Weather Factors
Weather remains one of the most unpredictable yet influential forces in grain markets. Seasonal cycles—planting in spring, growing in summer, harvest in autumn—create recurring patterns that savvy analysts exploit. By overlaying historical weather data with current forecasts, you can anticipate yield deviations and potential price reactions.
Regional Weather Reports
Corn belt moisture levels, Black Sea rainfall, and Australian drought conditions each carry different implications for global supply. Many reports include weekly crop condition ratings, indicating the percentage of fields rated “good” or “excellent.” Sudden shifts in these ratings often trigger short‐term market moves, especially during critical growth stages.
Using Historical Analogues
Comparing current seasons to past years with similar weather profiles can reveal likely yield outcomes. For instance, a year with early‐season drought followed by late rains might mirror previous cycles where final yields diverged significantly from initial projections. Historical analogues help set realistic expectations and prepare for potential price swings as new data emerges.
Applying Insights to Trading and Risk Strategies
Once you’ve processed report details, the next step is translating insight into action. Whether you’re a producer hedging a future harvest or a speculator seeking arbitrage opportunities, clear strategies and disciplined execution are key. Grain markets reward those who combine fundamental clarity with robust hedging and futures techniques.
Hedging with Futures and Options
- Establish baseline price levels with forward contracts or futures.
- Use options to set floors or ceilings, limiting downside while preserving upside.
- Implement calendar spreads to exploit relative value between delivery months.
Speculative Approaches
Speculators can leverage momentum strategies, buying on breakout above resistance or selling when support fails. Contrarian traders might enter when market sentiment appears overly bullish or bearish, based on commitment of traders reports. Regardless of method, clearly defined stop‐loss levels and position size limits ensure disciplined execution under unexpected market shifts.
Key Takeaway
The art of reading grain market reports lies in integrating diverse data streams—from statistical tables to weather updates and technical indicators—into a coherent market view. By mastering these tools and maintaining disciplined strategies, market participants can turn raw numbers into actionable insights, navigating the ever‐changing landscape of the global grain trade.