In grain trading, keeping an eye on the right indicators can spell the difference between profit and loss. This article explores key factors that shape price trends, risk management strategies, and actionable insights for both novice and seasoned traders. Understanding how these metrics interact is crucial for building a robust trading plan and adapting to shifts in global markets.
Global Supply and Demand Dynamics
Market participants must track the balance between supply and demand. A surplus or shortage can trigger strong price reactions, shaping trading opportunities.
- Harvest forecasts from major producers (e.g., the US, Brazil, and Ukraine)
- Consumption trends in top importers (e.g., China, EU, Egypt)
- Changes in biofuel policies affecting corn and soy usage
- Shifts in dietary patterns driving wheat and rice intake
When global supply tightens due to lower yields or export restrictions, prices often spike. Conversely, a glut of production can dampen market sentiment.
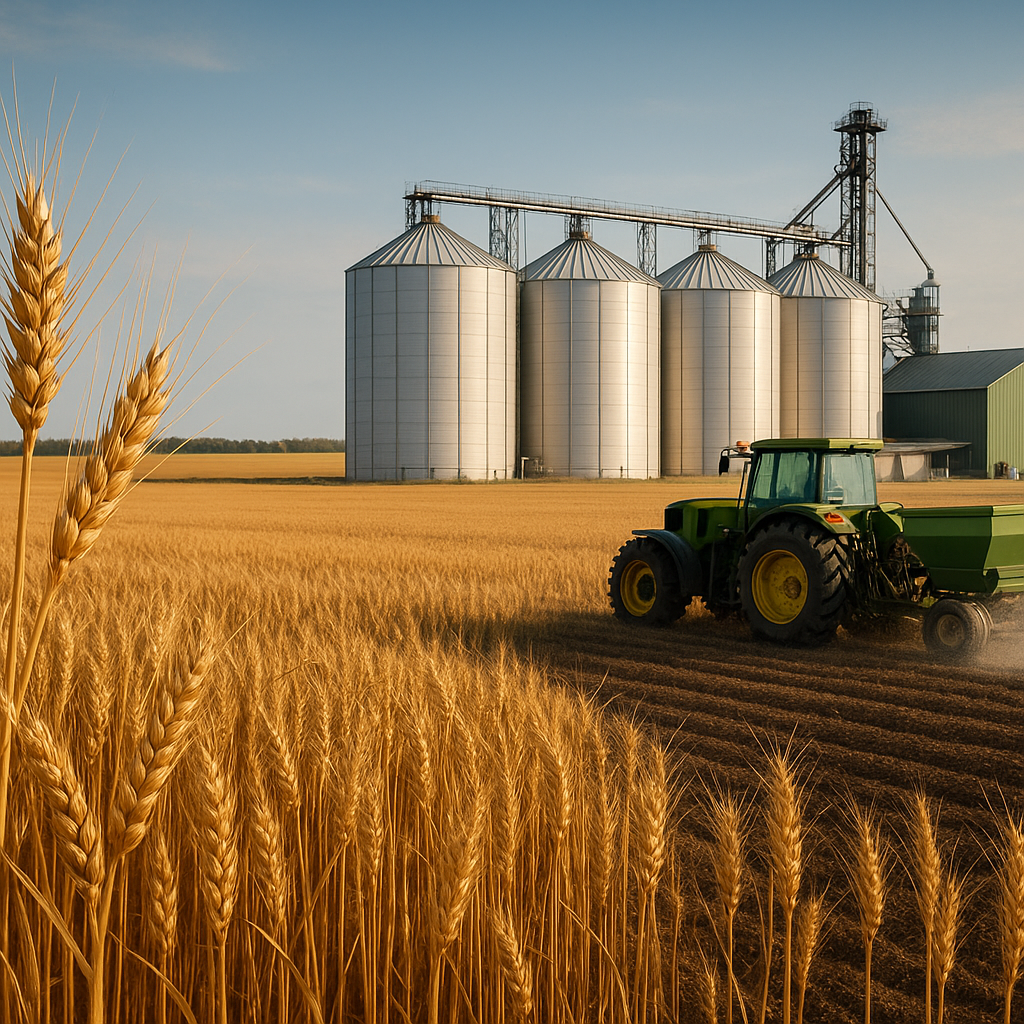
Weather and Crop Reports
Role of Agronomic Conditions
Weather remains one of the most unpredictable variables in agriculture. Droughts, floods, frost events, and heatwaves directly influence planting progress and yields.
- Crop planting percentages by region
- Soil moisture and temperature anomalies
- Satellite imagery assessing vegetation health
USDA and International Reports
The USDA releases monthly reports that serve as benchmarks for global grain markets. Other agencies like Brazil’s Conab and Europe’s MARS yield complementary data.
- World Agricultural Supply and Demand Estimates (WASDE)
- Crop Progress and Crop Condition Reports
- Quarterly Grain Stocks figures
A surprise revision in production estimates can spark sharp swings in both physical and paper markets.
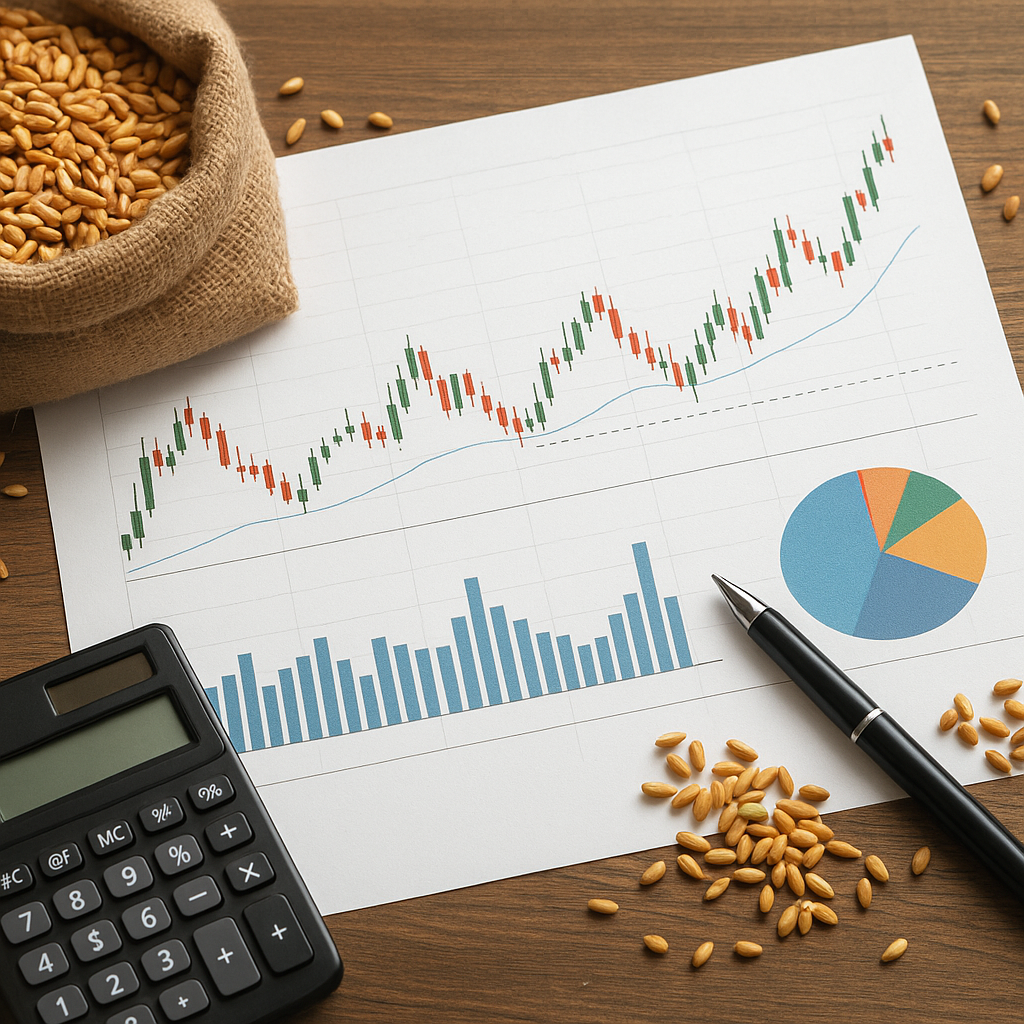
Futures Markets as Price Discoverers
Grain futures on exchanges such as CBOT and Euronext provide transparent platforms for hedging and speculation. Traders watch:
- Front-month contract prices and backwardation/contango structures
- Open interest as a gauge of market participation
- Basis levels reflecting cash versus futures differentials
Volatility metrics help traders assess risk. A spike in implied volatility may signal potential for larger-than-normal price swings, creating opportunities for option strategies.
Macro and Currency Influences
Broader economic trends often ripple through grain markets. Currency fluctuations, interest rates, and growth forecasts shape export and imports flows:
- US dollar strength generally pressures commodity prices, making exports more expensive
- Emerging market demand tied to local currency stability
- Global GDP projections affecting livestock feed requirements
Monitoring central bank announcements and trade balances can help anticipate shifts in grain trade flows. For example, a weaker dollar might boost US corn and soy exports.
Technical and Sentiment Indicators
Beyond fundamentals, technical analysis offers clues to market psychology. Key technical tools include:
- Moving averages (50-day, 200-day) to identify trend direction
- Relative Strength Index (RSI) for overbought or oversold levels
- Commitment of Traders (COT) reports revealing speculative positioning
Sentiment surveys and newsflow momentum trackers can complement classical charts. A sudden shift in large trader net positions may precede price reversals.
Government Policies and Trade Regulations
Subsidies, tariffs, and quotas have direct impacts on grain pricing. Examples include:
- Biofuel mandates in North America and Europe
- Export bans or duties imposed by key producers
- Support programs and crop insurance schemes
Regulatory changes can alter market liquidity overnight. Close attention to policy announcements helps traders anticipate structural changes in supply chains.
Logistics, Storage, and Transportation Costs
After harvest, grains move through a network of elevators, warehouses, rivers, and ports. Price variations between regions often reflect:
- Freight rate fluctuations on rail and barge systems
- Storage availability and seasonal carry costs
- Port congestion and shipping schedule delays
Inefficiencies in the chain can lead to localized premium or discount pockets, influencing spot and deferred contract spreads.